Technical Analysis of MRK 2024-05-03
Overview:
In analyzing the technical indicators for MRK over the last 5 days, we will delve into the trend, momentum, volatility, and volume indicators to provide a comprehensive outlook on the possible stock price movement in the coming days.
Trend Analysis:
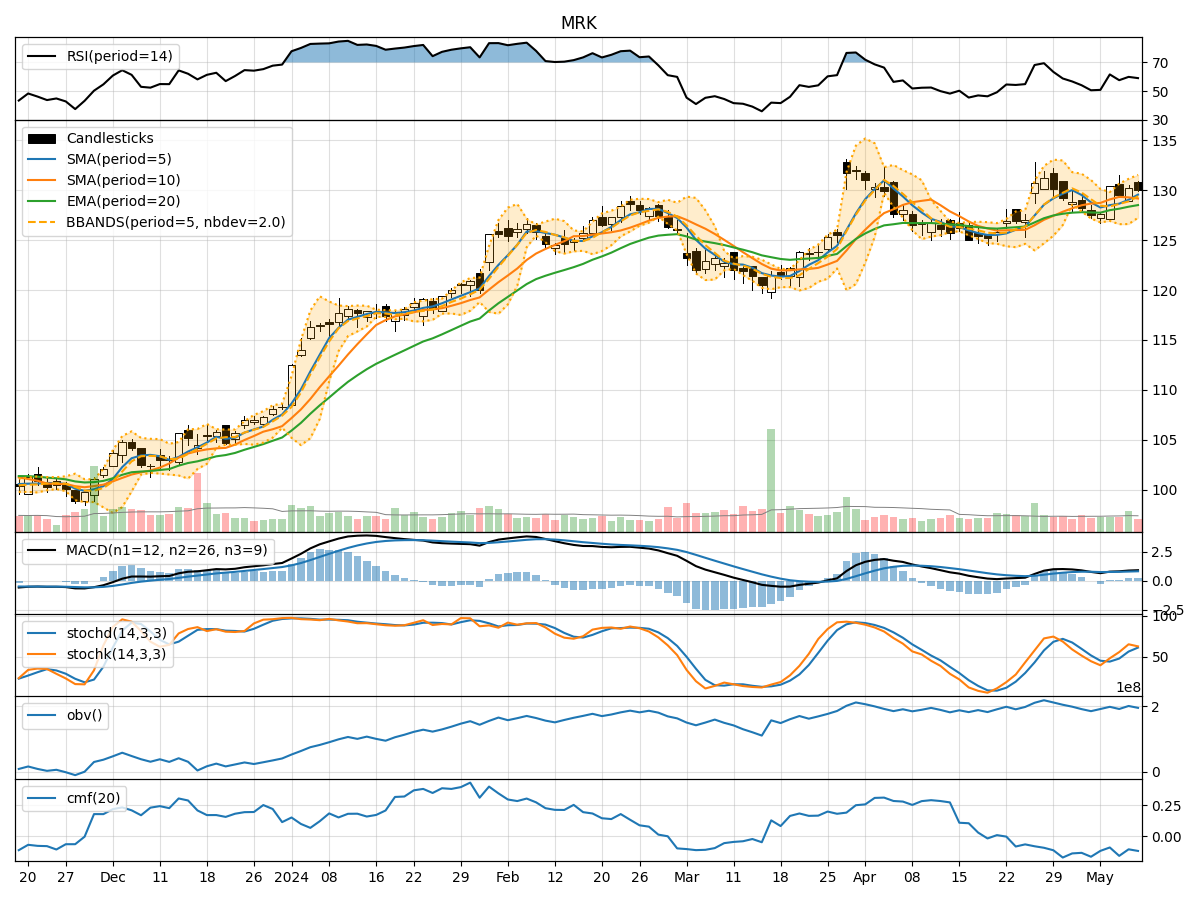
- Moving Averages (MA): The 5-day Moving Average (MA) has been fluctuating around the closing prices, indicating short-term price trends. The Simple Moving Average (SMA) and Exponential Moving Average (EMA) have been showing slight upward movements, suggesting a potential bullish sentiment.
- MACD: The MACD line has been positive, indicating a bullish trend. The MACD Histogram has been increasing, showing strengthening bullish momentum.
Momentum Analysis:
- RSI: The Relative Strength Index (RSI) has been declining but remains above 50, indicating a neutral to slightly bearish momentum.
- Stochastic Oscillator: Both %K and %D have been decreasing, signaling a bearish momentum. The stock is approaching oversold levels based on the Stochastic indicator.
- Williams %R: The Williams %R is in the oversold territory, suggesting a potential reversal or bounce.
Volatility Analysis:
- Bollinger Bands: The Bollinger Bands have been narrowing, indicating decreasing volatility. The price has been trading within the bands, suggesting a period of consolidation.
- Bollinger %B: The %B indicator has been hovering around 0.5, indicating the price is at the middle of the bands.
Volume Analysis:
- On-Balance Volume (OBV): The OBV has been declining, suggesting selling pressure in the stock.
- Chaikin Money Flow (CMF): The CMF has been negative, indicating outflow of money from the stock.
Conclusion:
Based on the analysis of the technical indicators: - Trend: The trend indicators suggest a potential bullish sentiment in the short term. - Momentum: Momentum indicators show a mixed signal with a slight bearish bias. - Volatility: Volatility indicators point towards a period of consolidation with decreasing volatility. - Volume: Volume indicators indicate selling pressure and outflow of money from the stock.
Overall Assessment:
- The stock is likely to experience a period of consolidation in the coming days with a potential upward bias.
- Short-term traders may consider waiting for a clearer signal before taking a position, while long-term investors could use any dips as buying opportunities.
Always remember to monitor the market closely and consider other fundamental factors before making any investment decisions.