Technical Analysis of MOS 2024-05-10
Overview:
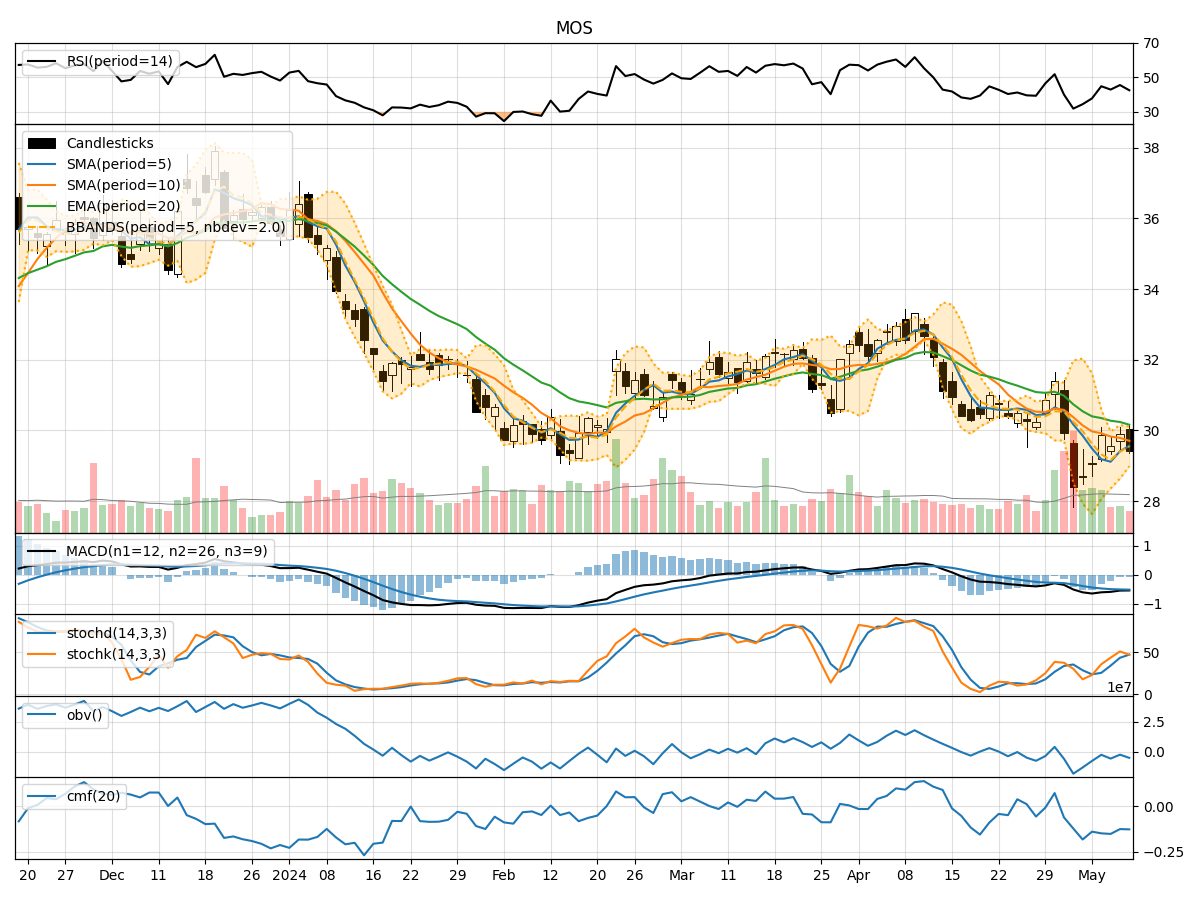
In the last 5 trading days, MOS stock has shown mixed signals across various technical indicators. The stock price has fluctuated within a narrow range, indicating indecision in the market. By analyzing trend, momentum, volatility, and volume indicators, we can gain insights into the potential future price movement of MOS stock.
Trend Indicators:
- Moving averages (MA) show a slight downtrend, with the 5-day MA below both the simple moving average (SMA) and exponential moving average (EMA).
- MACD is negative, indicating a bearish momentum in the short term.
- Overall, the trend indicators suggest a bearish sentiment in the short term.
Momentum Indicators:
- RSI is below 50, indicating a lack of strong buying momentum.
- Stochastic oscillators are in the neutral zone, suggesting a balanced momentum between buyers and sellers.
- Williams %R is in the oversold territory, signaling a potential reversal.
- The momentum indicators reflect a neutral to slightly bearish sentiment.
Volatility Indicators:
- Bollinger Bands are narrowing, indicating decreasing volatility.
- The Bollinger Band %B is below 0.5, suggesting a potential oversold condition.
- Volatility has been decreasing over the last few days.
- Volatility indicators point towards a consolidation phase with reduced price fluctuations.
Volume Indicators:
- On-Balance Volume (OBV) has been fluctuating, indicating uncertainty in the accumulation/distribution of the stock.
- Chaikin Money Flow (CMF) is negative, suggesting a net outflow of money from the stock.
- Volume has been decreasing, indicating lower participation in recent trading sessions.
- Volume indicators imply a lack of strong buying interest in the stock.
Conclusion:
Based on the analysis of trend, momentum, volatility, and volume indicators, the overall outlook for MOS stock in the next few days is bearish with a potential for further downside movement. The trend indicators, coupled with the lack of strong buying momentum and decreasing volatility, suggest a continuation of the current downtrend or a sideways movement with a bias towards the downside. Traders and investors should exercise caution and consider waiting for more definitive signals before making any significant trading decisions.