Technical Analysis of MOH 2024-05-10
Overview:
In analyzing the technical indicators for MOH over the last 5 days, we will delve into the trend, momentum, volatility, and volume indicators to provide a comprehensive outlook on the possible stock price movement. By examining these key aspects, we aim to offer valuable insights and predictions for the upcoming days.
Trend Analysis:
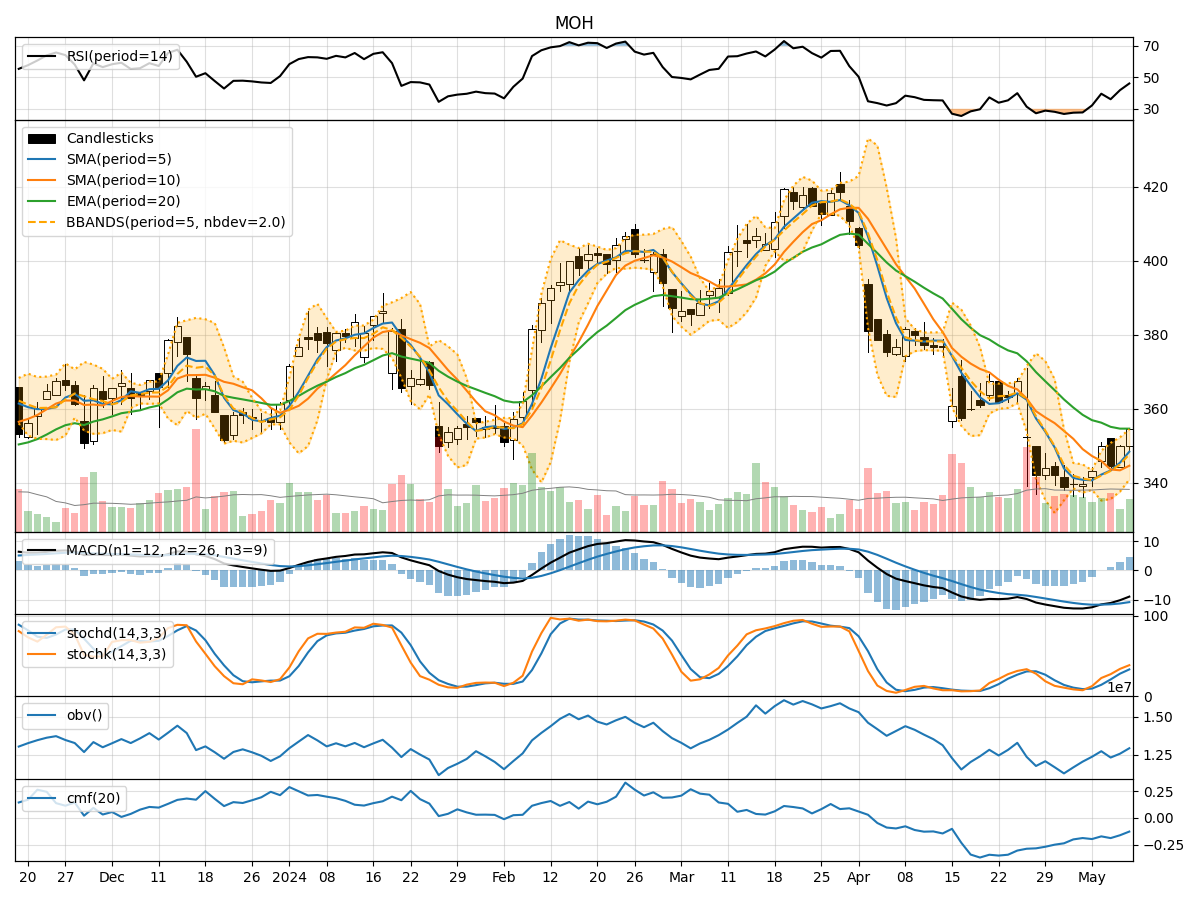
- Moving Averages (MA): The 5-day Moving Average (MA) has been showing an upward trend, indicating a positive momentum in the stock price.
- MACD: The Moving Average Convergence Divergence (MACD) has been consistently decreasing, suggesting a potential reversal in the short-term trend.
- RSI: The Relative Strength Index (RSI) has been gradually increasing, reflecting a strengthening momentum in the stock.
Momentum Analysis:
- Stochastic Oscillator: Both %K and %D values have been rising, indicating an increasing buying pressure and positive momentum.
- Williams %R: The Williams %R is moving towards the oversold region, suggesting a potential buying opportunity in the stock.
Volatility Analysis:
- Bollinger Bands: The Bollinger Bands have been widening, indicating increased volatility in the stock price.
- Average True Range (ATR): The ATR value has been rising, signifying an uptick in volatility levels.
Volume Analysis:
- On-Balance Volume (OBV): The OBV has been fluctuating, indicating mixed sentiment among investors.
- Chaikin Money Flow (CMF): The CMF has been negative, suggesting a net outflow of money from the stock.
Key Observations:
- The stock is currently in an upward trend based on the moving averages and RSI.
- Momentum indicators like the Stochastic Oscillator and Williams %R point towards positive momentum in the stock.
- Volatility has been increasing, as seen in the widening Bollinger Bands and rising ATR.
- The volume indicators show mixed sentiment among investors, with the OBV fluctuating and CMF negative.
Conclusion:
Based on the analysis of the technical indicators, the next few days' possible stock price movement for MOH is likely to be upward with increased volatility. The positive momentum indicated by the Stochastic Oscillator and RSI, along with the upward trend in moving averages, suggests a potential continuation of the current uptrend. However, investors should remain cautious of the increasing volatility levels and monitor the OBV and CMF for any shifts in sentiment. Overall, the outlook for MOH appears bullish in the short term.