Technical Analysis of MOGU 2024-05-10
Overview:
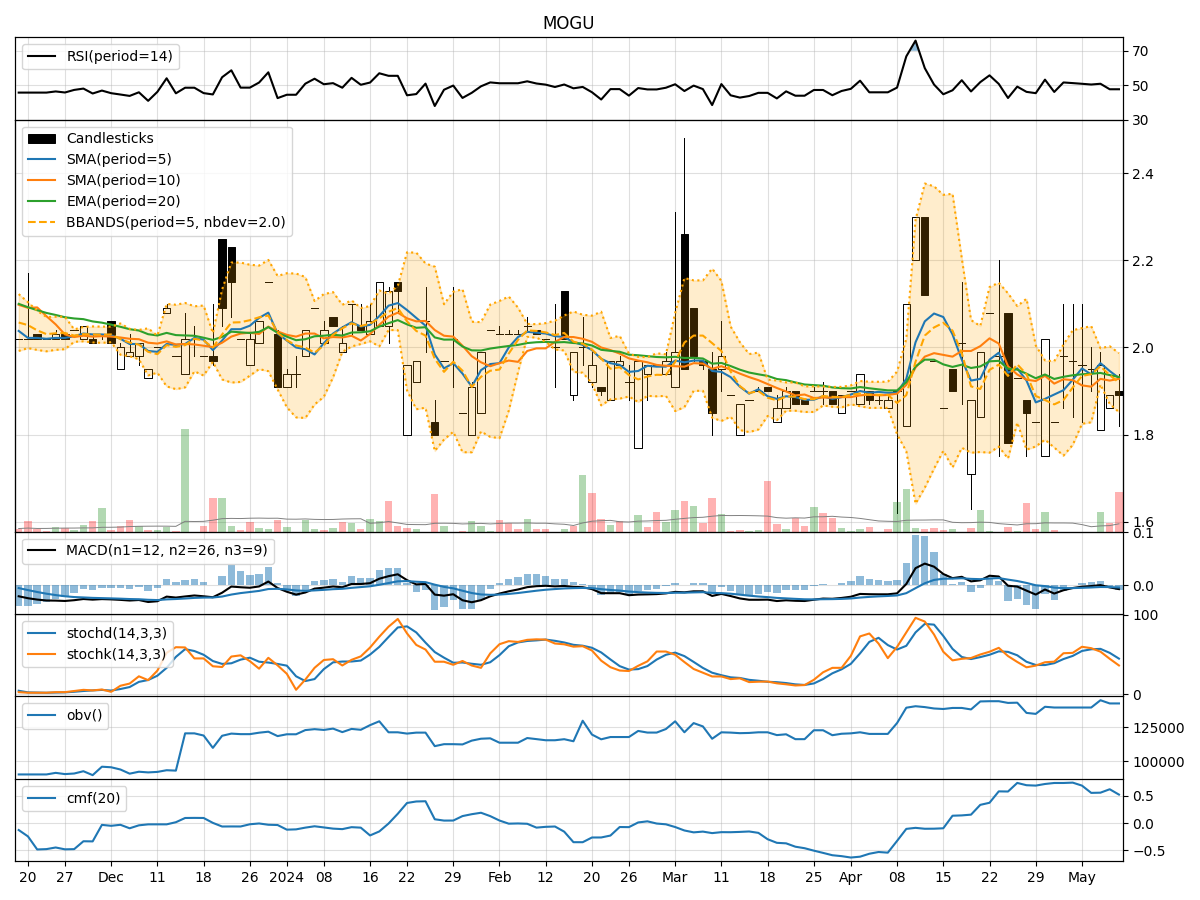
In analyzing the technical indicators for MOGU over the last 5 days, we will delve into the trend, momentum, volatility, and volume indicators to provide a comprehensive outlook on the possible stock price movement in the coming days.
Trend Analysis:
- Moving Averages (MA): The 5-day MA has been fluctuating around the current price, indicating a lack of clear trend direction.
- MACD: The MACD line has been consistently below the signal line, suggesting a bearish momentum in the short term.
- RSI: The RSI has been hovering around the neutral zone, indicating indecision in the market sentiment.
Momentum Analysis:
- Stochastic Oscillator: Both %K and %D have been declining, signaling a potential bearish momentum.
- Williams %R: The indicator has been in oversold territory, indicating a possible reversal in the short term.
Volatility Analysis:
- Bollinger Bands (BB): The bands have been narrowing, suggesting decreasing volatility in the stock price.
- BB %B: The %B indicator has been fluctuating around the midline, indicating a lack of clear trend direction.
Volume Analysis:
- On-Balance Volume (OBV): The OBV has been relatively flat, indicating a balance between buying and selling pressure.
- Chaikin Money Flow (CMF): The CMF has been fluctuating around the neutral level, reflecting a neutral money flow trend.
Key Observations:
- The stock is currently exhibiting a lack of clear trend direction, with mixed signals from the trend indicators.
- Momentum indicators suggest a potential bearish bias in the short term, supported by the declining stochastic oscillator.
- Volatility has been decreasing, indicating a possible period of consolidation or sideways movement.
- Volume indicators show a balanced buying and selling pressure, with no significant accumulation or distribution signals.
Conclusion:
Based on the analysis of the technical indicators, the short-term outlook for MOGU appears to be bearish. The lack of clear trend direction, coupled with bearish signals from momentum indicators, suggests a potential downward movement in the stock price. Traders should exercise caution and consider waiting for more definitive signals before making any trading decisions.