Technical Analysis of MANU 2024-05-10
Overview:
In analyzing the technical indicators for MANU over the last 5 days, we will delve into the trend, momentum, volatility, and volume indicators to provide a comprehensive outlook on the possible stock price movement. By examining these key factors, we aim to offer valuable insights and predictions for the upcoming days.
Trend Indicators:
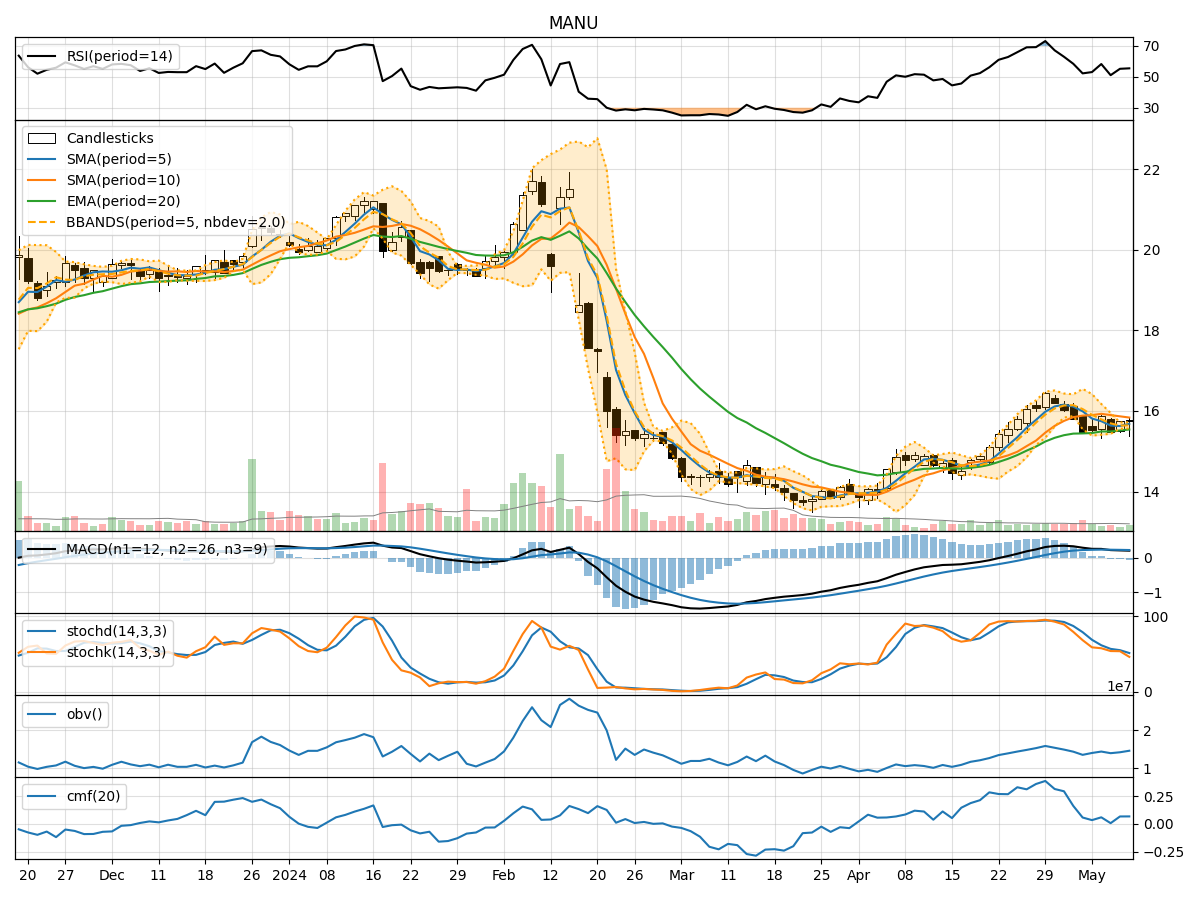
- Moving Averages (MA): The 5-day MA has been fluctuating around the closing prices, indicating short-term price trends. The SMA(10) and EMA(20) show a slight downward trend, suggesting a potential bearish sentiment.
- MACD: The MACD line has been positive but decreasing, while the MACD Histogram has been moving towards the zero line. This could signal a weakening bullish momentum.
- Conclusion: The trend indicators point towards a potential downward movement in the stock price.
Momentum Indicators:
- RSI: The RSI has been hovering around the neutral zone, indicating a balanced momentum between buying and selling pressure.
- Stochastic Oscillator: Both %K and %D have been fluctuating, with %K showing a recent decline. The stock is not in overbought or oversold territory.
- Conclusion: The momentum indicators suggest a sideways movement in the stock price.
Volatility Indicators:
- Bollinger Bands (BB): The stock price has been trading within the bands, with the %B indicator showing fluctuations. The bands are not significantly expanding or contracting.
- Conclusion: Volatility remains relatively stable, indicating a consolidation phase in the stock price.
Volume Indicators:
- On-Balance Volume (OBV): The OBV has been fluctuating, indicating mixed buying and selling pressure.
- Chaikin Money Flow (CMF): The CMF has been positive but relatively flat, suggesting a balance between accumulation and distribution.
- Conclusion: Volume indicators reflect a neutral sentiment in the stock price.
Overall Conclusion:
Based on the analysis of trend, momentum, volatility, and volume indicators, the next few days for MANU stock are likely to see a downward movement in price, with sideways momentum and consolidation in volatility. The stock is expected to trade within a range with no clear trend direction. Traders may consider adopting a cautious approach and closely monitor key support and resistance levels for potential trading opportunities.
Key Recommendations:
- Monitor Support and Resistance Levels: Keep a close eye on key support and resistance levels to identify potential entry and exit points.
- Use Stop-Loss Orders: Implement stop-loss orders to manage risk in case of unexpected price movements.
- Stay Informed: Stay updated on market news and events that could impact MANU stock price.
- Diversify Portfolio: Consider diversifying your portfolio to mitigate risks associated with individual stock movements.
By incorporating these recommendations and staying vigilant of market dynamics, investors can navigate the uncertainties and make informed decisions regarding MANU stock.