Technical Analysis of LYV 2024-05-10
Overview:
In analyzing the technical indicators for Live Nation Entertainment Inc. (LYV) over the last 5 days, we will delve into the trends, momentum, volatility, and volume indicators to provide insights into the possible future stock price movements. By examining these key aspects, we aim to offer a comprehensive analysis and make informed predictions for the upcoming days.
Trend Analysis:
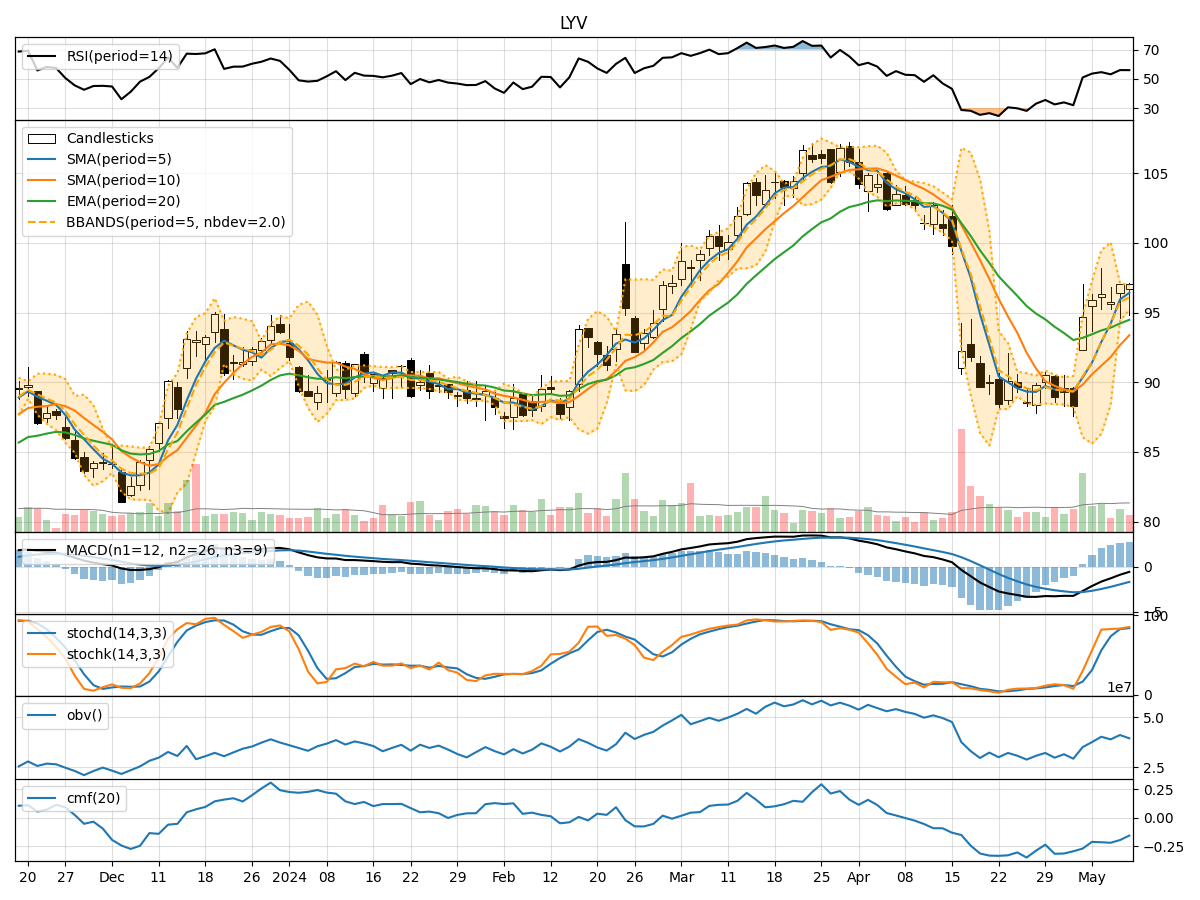
- Moving Averages (MA): The 5-day Moving Average (MA) has been consistently rising, indicating a bullish trend in the short term.
- MACD: The Moving Average Convergence Divergence (MACD) has shown positive values, suggesting bullish momentum.
- EMA: The Exponential Moving Average (EMA) has been trending upwards, supporting the bullish sentiment.
Key Observation: The trend indicators point towards a bullish outlook for LYV in the short term.
Momentum Analysis:
- RSI: The Relative Strength Index (RSI) has been hovering around the neutral zone, indicating a balanced momentum.
- Stochastic Oscillator: Both %K and %D values have been in the overbought territory, suggesting a potential reversal.
- Williams %R: The Williams %R indicator is also in the oversold region, signaling a possible bearish reversal.
Key Observation: The momentum indicators show mixed signals, with a slight bias towards a bearish reversal.
Volatility Analysis:
- Bollinger Bands (BB): The Bollinger Bands have been narrowing, indicating decreasing volatility.
- BB%: The %B indicator has been fluctuating within a tight range, reflecting stable price movements.
Key Observation: Volatility has been decreasing, suggesting a period of consolidation or a potential breakout.
Volume Analysis:
- On-Balance Volume (OBV): The OBV has shown mixed movements, indicating indecision among market participants.
- Chaikin Money Flow (CMF): The CMF has been negative, signaling selling pressure in the stock.
Key Observation: Volume indicators suggest a lack of strong conviction among traders, with a slight bias towards selling pressure.
Conclusion:
Based on the analysis of the technical indicators, the short-term outlook for LYV is mixed. While the trend indicators point towards a bullish sentiment, the momentum indicators suggest a potential bearish reversal. The decreasing volatility indicates a period of consolidation, while the volume indicators reflect indecisiveness in the market.
Key Conclusion: The next few days for LYV could see sideways movement with a slight bearish bias. Traders should closely monitor key support and resistance levels for potential breakout opportunities.
Disclaimer:
This analysis is based solely on technical indicators and does not take into account fundamental factors or external market influences. It is essential to conduct thorough research and consider multiple perspectives before making any investment decisions.