Technical Analysis of LYB 2024-05-10
Overview:
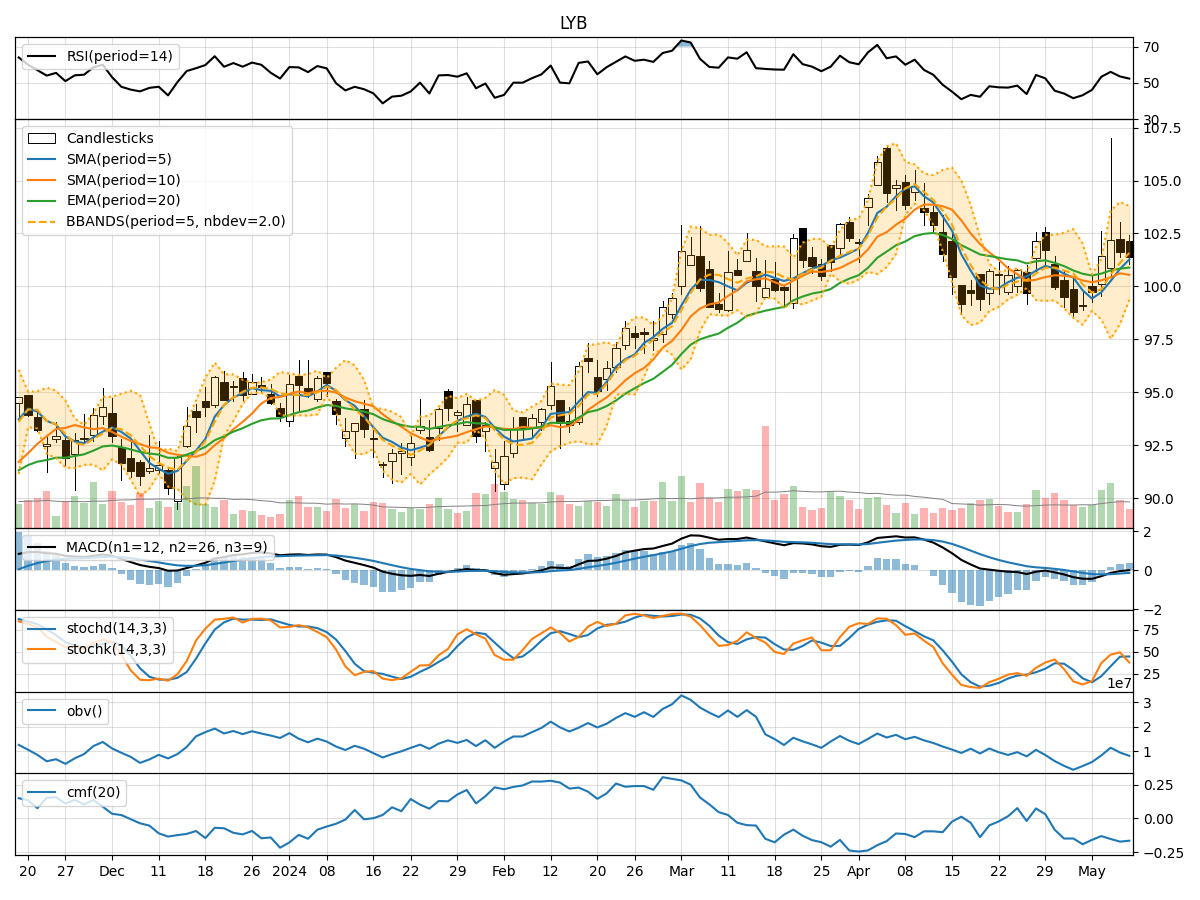
In analyzing the technical indicators for LYB over the last 5 days, we will delve into the trend, momentum, volatility, and volume indicators to provide a comprehensive outlook on the possible stock price movement in the coming days.
Trend Analysis:
- Moving Averages (MA): The 5-day Moving Average has been showing an upward trend, indicating a positive momentum in the stock price.
- MACD: The MACD line has been consistently above the signal line, suggesting a bullish trend.
- EMA: The Exponential Moving Average has been trending upwards, supporting the bullish sentiment in the short term.
Momentum Analysis:
- RSI: The Relative Strength Index has been hovering around the neutral zone, indicating a balanced momentum in the stock.
- Stochastic Oscillator: Both %K and %D have been fluctuating, showing indecision in the momentum.
- Williams %R: The Williams %R is in the oversold territory, suggesting a potential reversal in the momentum.
Volatility Analysis:
- Bollinger Bands: The stock price has been trading within the bands, indicating a period of consolidation.
- Bollinger %B: The %B indicator is below 1, suggesting the stock is trading below the upper band and might see a potential uptrend.
Volume Analysis:
- On-Balance Volume (OBV): The OBV has been declining, indicating selling pressure in the stock.
- Chaikin Money Flow (CMF): The CMF is negative, suggesting outflow of money from the stock.
Key Observations:
- The trend indicators are predominantly bullish, supported by moving averages and MACD.
- Momentum indicators show mixed signals with RSI neutral, Stochastic oscillating, and Williams %R in oversold territory.
- Volatility indicators point towards consolidation within Bollinger Bands.
- Volume indicators reflect a decrease in buying pressure with OBV declining and CMF negative.
Conclusion:
Based on the analysis of technical indicators, the stock price of LYB is likely to experience sideways movement in the coming days. The bullish trend indicated by moving averages and MACD might be hindered by the mixed momentum signals and declining volume indicators. Traders should exercise caution and wait for clearer signals before making significant trading decisions.