Technical Analysis of LU 2024-05-10
Overview:
In analyzing the technical indicators for LU stock over the last 5 days, we will delve into the trend, momentum, volatility, and volume indicators to provide a comprehensive outlook on the possible stock price movement in the coming days. By examining these key indicators, we aim to offer valuable insights and predictions to guide investment decisions.
Trend Analysis:
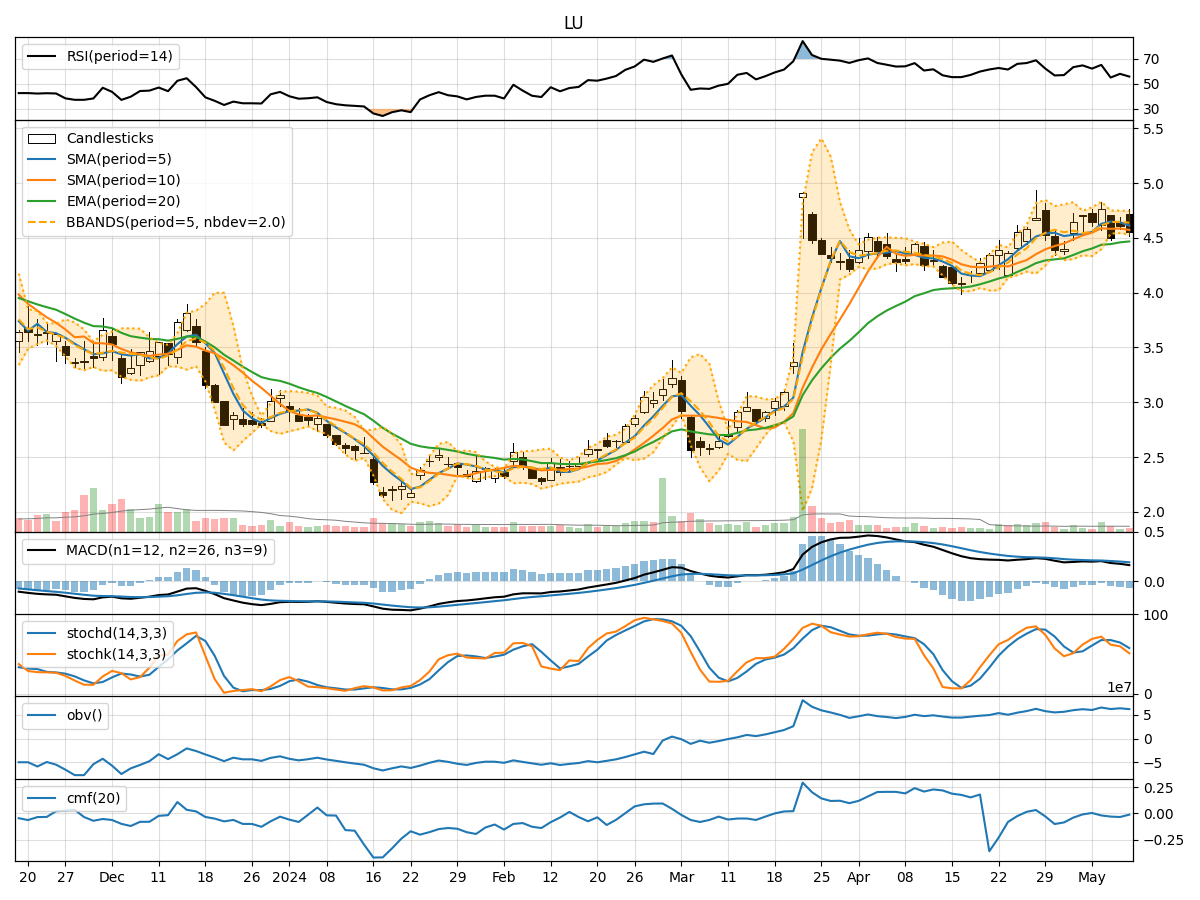
- Moving Averages (MA): The 5-day Moving Average (MA) has been fluctuating around the closing prices, indicating short-term price trends. The Simple Moving Average (SMA) and Exponential Moving Average (EMA) show a slight upward trend, suggesting potential bullish momentum.
- MACD: The Moving Average Convergence Divergence (MACD) and its signal line have been negative, but the MACD Histogram is showing signs of convergence towards the signal line, hinting at a possible trend reversal.
Momentum Analysis:
- RSI: The Relative Strength Index (RSI) has been oscillating around the 50 level, indicating a balanced momentum between buying and selling pressure.
- Stochastic Oscillator: Both %K and %D lines of the Stochastic Oscillator are in the oversold region, suggesting a potential buying opportunity.
- Williams %R: The Williams %R is also in the oversold territory, indicating a possible reversal in the near term.
Volatility Analysis:
- Bollinger Bands (BB): The Bollinger Bands are narrowing, indicating decreasing volatility and a potential price breakout in the near future.
- Bollinger %B: The %B indicator is hovering around the middle band, suggesting a period of consolidation and uncertainty in price direction.
Volume Analysis:
- On-Balance Volume (OBV): The OBV has been relatively stable, indicating a balance between buying and selling pressure.
- Chaikin Money Flow (CMF): The CMF is negative, suggesting that money is flowing out of the stock, potentially signaling a bearish sentiment.
Conclusion:
Based on the analysis of the technical indicators, the stock of LU is currently in a consolidation phase with mixed signals across different indicators. The trend indicators show a potential for a bullish reversal in the short term, supported by the moving averages and MACD convergence. However, the momentum indicators suggest a neutral stance with oscillating RSI and oversold stochastic levels.
The volatility indicators point towards a potential breakout due to the narrowing Bollinger Bands, while the volume indicators indicate a balanced market sentiment with a slight bearish bias based on the CMF.
In conclusion, while there are indications of a possible bullish reversal in the short term, investors should exercise caution and closely monitor the price action for confirmation. It is advisable to wait for a clear signal or confirmation from multiple indicators before making any significant trading decisions.