Technical Analysis of LOW 2024-05-10
Overview:
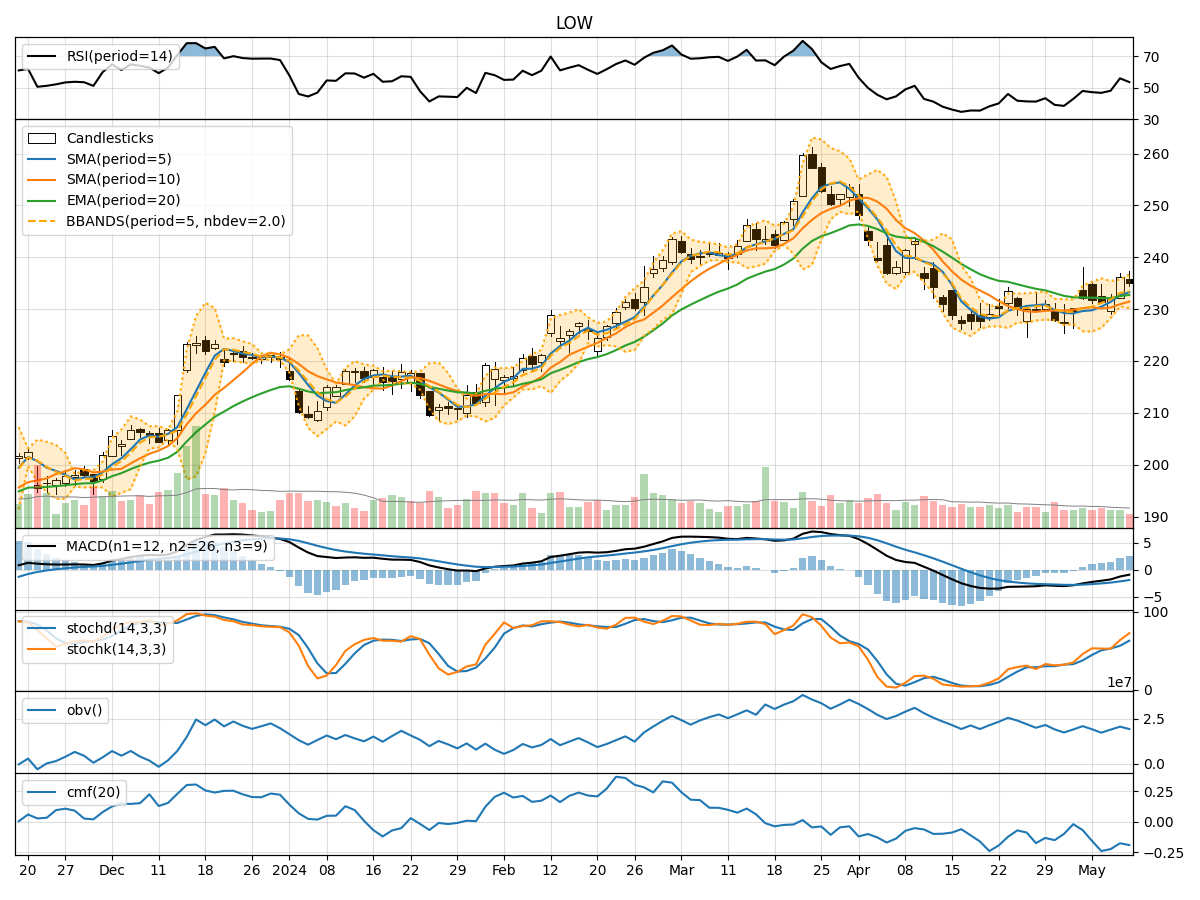
In analyzing the technical indicators for LOW stock over the last 5 days, we will delve into the trend, momentum, volatility, and volume indicators to provide a comprehensive outlook on the possible stock price movement in the coming days. By examining these key aspects, we aim to offer valuable insights and predictions for potential investors.
Trend Indicators:
- Moving Averages (MA): The 5-day Moving Average (MA) has been showing an upward trend, indicating a positive momentum in the stock price.
- MACD (Moving Average Convergence Divergence): The MACD has been consistently increasing over the past 5 days, suggesting a strengthening bullish momentum.
- EMA (Exponential Moving Average): The EMA has been relatively stable, indicating a consistent trend in the stock price.
Momentum Indicators:
- RSI (Relative Strength Index): The RSI has been fluctuating around the neutral zone, indicating a balanced momentum in the stock.
- Stochastic Oscillator: Both %K and %D values have been increasing, signaling a bullish momentum in the stock.
- Williams %R (Willams Percentage Range): The Williams %R has been hovering in the oversold territory, suggesting a potential reversal in the stock price.
Volatility Indicators:
- Bollinger Bands (BB): The Bollinger Bands have been widening, indicating increased volatility in the stock price.
- BB% (Bollinger Bands Percentage): The BB% has been fluctuating, suggesting potential price swings in the stock.
- Average True Range (ATR): The ATR has been relatively stable, indicating consistent volatility levels in the stock.
Volume Indicators:
- On-Balance Volume (OBV): The OBV has been fluctuating, indicating mixed sentiment among investors regarding the stock.
- Chaikin Money Flow (CMF): The CMF has been negative, suggesting a bearish sentiment in the stock.
Key Observations and Opinions:
- Trend: The trend indicators suggest a bullish sentiment in the stock, supported by the increasing moving averages and MACD.
- Momentum: The momentum indicators show a mixed sentiment, with RSI indicating neutrality, while the Stochastic Oscillator signals a bullish momentum.
- Volatility: Volatility indicators point towards increased price fluctuations, which could lead to potential trading opportunities.
- Volume: The volume indicators reflect mixed sentiment among investors, with OBV fluctuating and CMF indicating a bearish sentiment.
Conclusion:
Based on the analysis of the technical indicators, the stock price of LOW is likely to experience further upward movement in the coming days. The bullish trend indicated by moving averages and MACD, coupled with the positive momentum shown by the Stochastic Oscillator, suggests a favorable outlook for the stock. However, investors should remain cautious of the increased volatility as indicated by the Bollinger Bands and monitor the volume trends closely for any shifts in market sentiment. Overall, the technical analysis points towards a bullish view for the stock price of LOW in the near term.