Technical Analysis of LOMA 2024-05-10
Overview:
In analyzing the technical indicators for LOMA over the last 5 days, we will delve into the trend, momentum, volatility, and volume indicators to provide a comprehensive outlook on the possible stock price movement. By examining these key aspects, we aim to offer valuable insights and predictions for the upcoming days.
Trend Analysis:
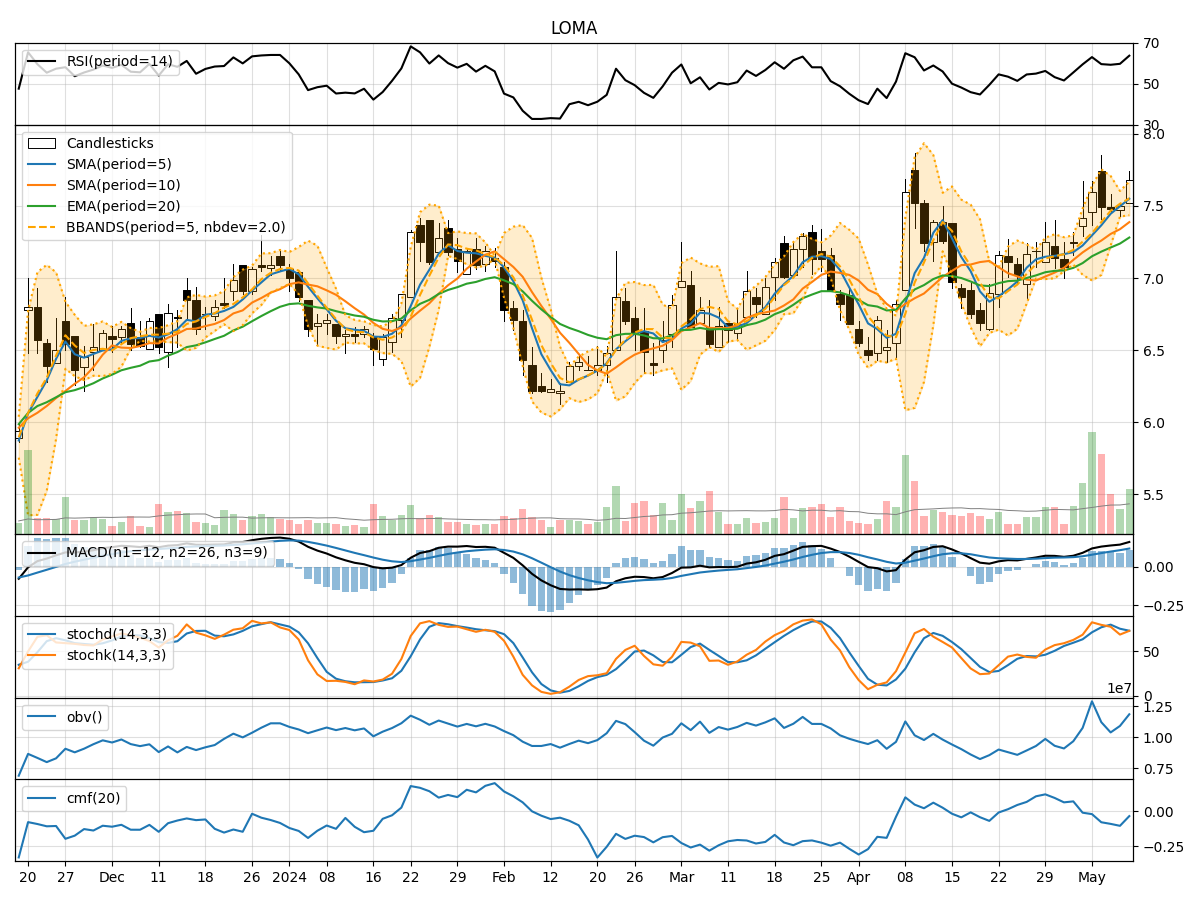
- Moving Averages (MA): The 5-day Moving Average (MA) has been consistently above the closing prices, indicating an upward trend. This suggests that the stock price has been trending higher over the past few days.
- MACD and Signal Line: The MACD line has been positive and above the signal line, further confirming the bullish momentum in the stock price.
- Relative Strength Index (RSI): The RSI values have been fluctuating but generally staying above 50, indicating bullish momentum in the stock.
Momentum Analysis:
- Stochastic Oscillator: The Stochastic Oscillator has been fluctuating but staying within the overbought territory, suggesting strong buying momentum in the stock.
- Williams %R (WillR): The Williams %R has been negative but improving, indicating a potential reversal in the downward momentum.
Volatility Analysis:
- Bollinger Bands (BB): The Bollinger Bands have been narrowing, indicating decreasing volatility in the stock price. This could suggest a period of consolidation or a potential breakout in the near future.
Volume Analysis:
- On-Balance Volume (OBV): The OBV has been fluctuating but generally showing a positive trend, indicating accumulation by investors.
- Chaikin Money Flow (CMF): The CMF has been negative, suggesting selling pressure in the stock.
Key Observations:
- The trend indicators suggest a bullish bias in the stock price, supported by the positive MACD and RSI values.
- Momentum indicators indicate strong buying momentum with the Stochastic Oscillator in the overbought zone.
- Volatility is decreasing, potentially leading to a period of consolidation before a breakout.
- Volume indicators show a mixed picture with OBV trending positively but CMF indicating selling pressure.
Conclusion:
Based on the analysis of the technical indicators, the next few days for LOMA stock price could see a continuation of the bullish trend with strong buying momentum. However, the decreasing volatility might lead to a period of consolidation before a potential breakout. Investors should monitor the price action closely for any signs of a reversal or continuation of the current trend.