Technical Analysis of LITB 2024-05-10
Overview:
In analyzing the technical indicators for LITB over the last 5 days, we will delve into the trend, momentum, volatility, and volume indicators to provide a comprehensive outlook on the possible stock price movement in the coming days. By examining these key aspects, we aim to offer valuable insights and predictions for informed decision-making.
Trend Analysis:
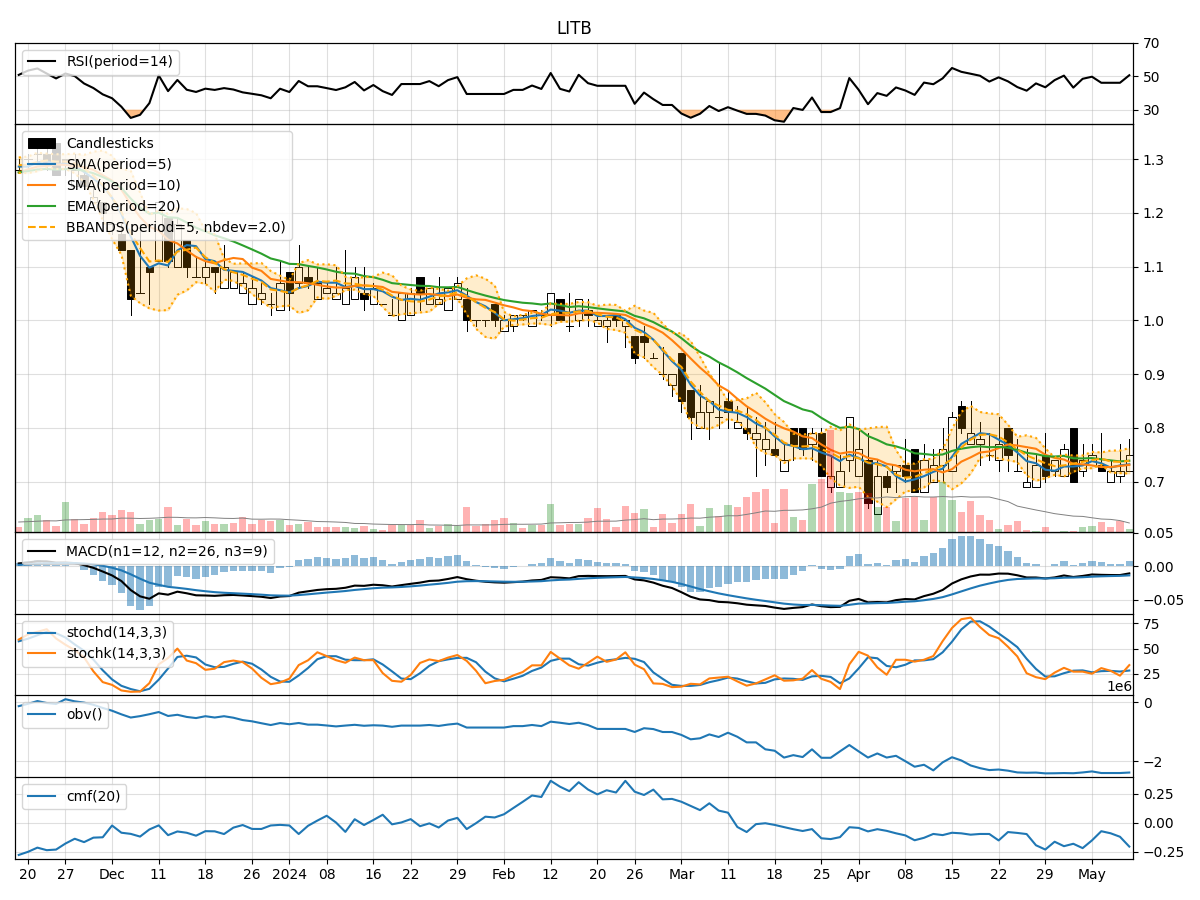
- Moving Averages (MA): The 5-day MA has been fluctuating around the closing prices, indicating a lack of clear trend direction.
- MACD: The MACD line has been consistently below the signal line, suggesting a bearish momentum in the short term.
Momentum Analysis:
- RSI: The RSI values have been hovering around the neutral zone, indicating a lack of strong buying or selling pressure.
- Stochastic Oscillator: Both %K and %D values have been relatively low, reflecting a potential oversold condition.
Volatility Analysis:
- Bollinger Bands (BB): The stock price has been trading within the bands, showing no extreme volatility.
Volume Analysis:
- On-Balance Volume (OBV): The OBV values have been declining, indicating selling pressure in the market.
- Chaikin Money Flow (CMF): The CMF values have been negative, suggesting a lack of buying interest.
Key Observations:
- The stock is currently in a sideways trend with no clear direction indicated by the moving averages.
- Momentum indicators suggest a bearish bias in the short term due to the MACD and stochastic oscillator readings.
- Volatility remains stable with the price trading within the Bollinger Bands.
- Volume indicators point towards selling pressure as reflected by the declining OBV and negative CMF values.
Conclusion:
Based on the analysis of the technical indicators, the next few days for LITB are likely to see further downside movement. The bearish momentum indicated by the MACD and stochastic oscillator, coupled with the selling pressure reflected in the volume indicators, suggests a potential continuation of the current downward trend. Traders and investors should exercise caution and consider waiting for more positive signals before considering any long positions.