Technical Analysis of LICY 2024-05-10
Overview:
In analyzing the technical indicators for LICY stock over the last 5 days, we will delve into the trend, momentum, volatility, and volume indicators to provide a comprehensive outlook on the possible stock price movement in the coming days. By examining these key indicators, we aim to offer valuable insights and recommendations for potential investors.
Trend Analysis:
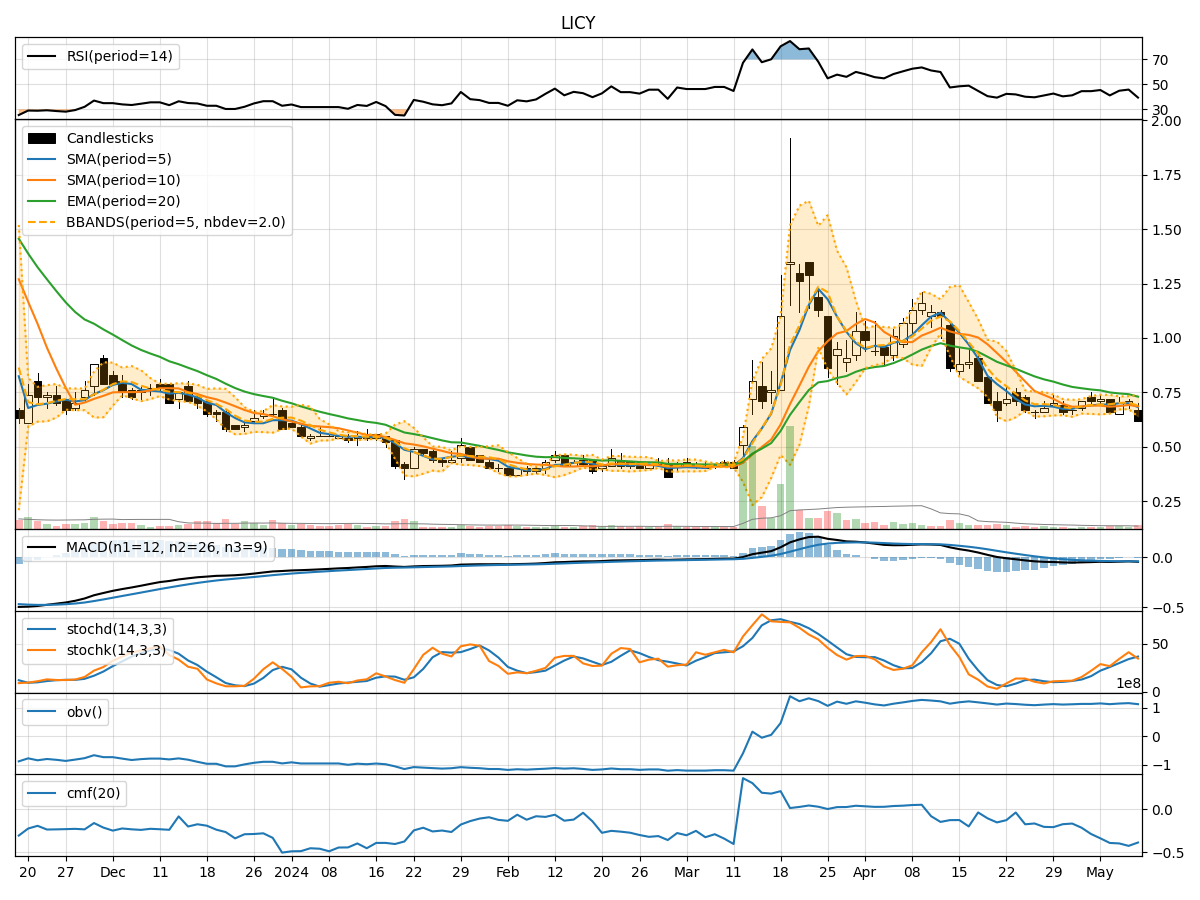
- Moving Averages (MA): The 5-day Moving Average (MA) has been fluctuating around the stock price, indicating short-term price trends. The Simple Moving Average (SMA) and Exponential Moving Average (EMA) show a downward trend, suggesting a bearish sentiment.
- MACD: The Moving Average Convergence Divergence (MACD) and its signal line (MACDH) have been negative, indicating a bearish momentum in the stock price.
Momentum Analysis:
- RSI: The Relative Strength Index (RSI) has been below 50, indicating a bearish momentum in the stock.
- Stochastic Oscillator: Both %K and %D have been below 50, suggesting a bearish sentiment in the stock price momentum.
Volatility Analysis:
- Bollinger Bands (BB): The Bollinger Bands have been narrowing, indicating decreasing volatility in the stock price.
- Bollinger %B: The %B has been fluctuating around 0.5, suggesting a neutral stance in terms of volatility.
Volume Analysis:
- On-Balance Volume (OBV): The OBV has been relatively stable, indicating a balance between buying and selling pressure.
- Chaikin Money Flow (CMF): The CMF has been negative, indicating a bearish sentiment in the stock price.
Key Observations:
- The trend indicators, momentum indicators, and volume indicators all point towards a bearish sentiment in the stock price movement.
- Volatility has been decreasing, suggesting a possible period of consolidation or sideways movement in the stock.
Conclusion:
Based on the analysis of the technical indicators, the next few days' possible stock price movement for LICY is likely to be downward. The bearish trend, negative momentum, and bearish volume indicators all align to indicate a potential further decline in the stock price. Investors should exercise caution and consider waiting for more positive signals before considering any long positions in LICY.