Technical Analysis of LH 2024-05-10
Overview:
In analyzing the technical indicators for LH stock over the last 5 days, we will delve into the trend, momentum, volatility, and volume indicators to provide a comprehensive outlook on the possible stock price movement in the coming days. By examining these key indicators, we aim to offer valuable insights and predictions for potential investors.
Trend Analysis:
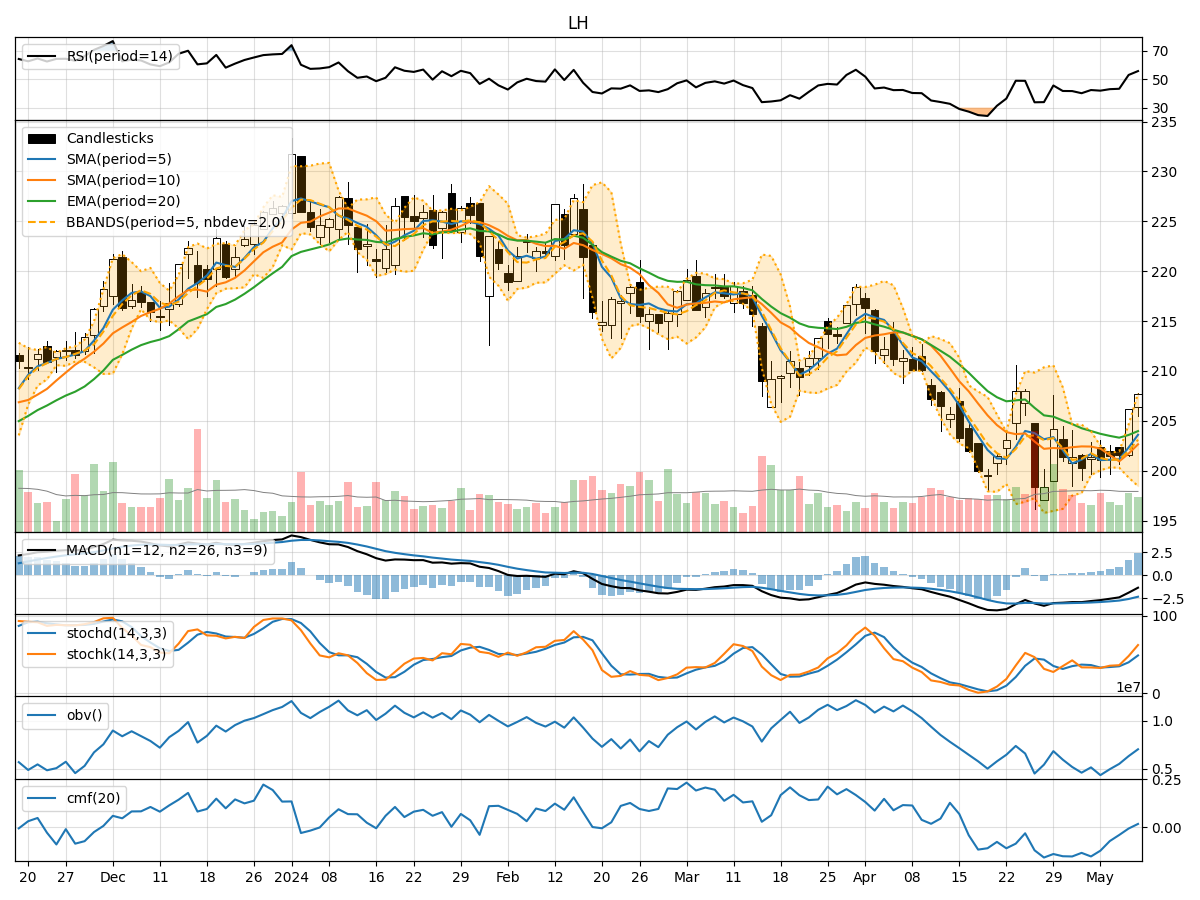
- Moving Averages (MA): The 5-day moving average has been consistently below the closing prices, indicating a short-term downtrend.
- MACD: The MACD line has been negative but showing signs of convergence towards the signal line, suggesting a potential reversal in the trend.
- EMA: The exponential moving average has been declining, reflecting a bearish sentiment in the short to medium term.
Momentum Analysis:
- RSI: The Relative Strength Index has been gradually increasing, indicating a strengthening momentum in the stock.
- Stochastic Oscillator: Both %K and %D lines have been rising, signaling increasing buying pressure and positive momentum.
- Williams %R: The indicator has been moving towards the oversold region, suggesting a potential buying opportunity.
Volatility Analysis:
- Bollinger Bands: The bands have been widening, indicating increased volatility in the stock price.
- Bollinger %B: The %B indicator has been fluctuating within a wide range, reflecting the heightened volatility in the stock.
Volume Analysis:
- On-Balance Volume (OBV): The OBV has been declining, suggesting a divergence between price and volume, which could indicate weakening buying interest.
- Chaikin Money Flow (CMF): The CMF has been negative, indicating outflow of money from the stock.
Conclusion:
Based on the analysis of the technical indicators, the stock of LH is likely to experience further downside movement in the coming days. The trend indicators suggest a bearish sentiment, with moving averages and MACD signaling a potential continuation of the downtrend. Momentum indicators, although showing some signs of strength, are not strong enough to reverse the overall bearish outlook. Volatility remains high, indicating potential sharp price movements, while volume indicators point towards a lack of strong buying interest.
Therefore, it is recommended to exercise caution and consider a bearish stance on LH stock in the near term. Traders may look for short-selling opportunities or wait for more definitive signs of a trend reversal before considering long positions. It is crucial to monitor the indicators closely for any shifts in market dynamics that could alter this outlook.