Technical Analysis of LEV 2024-05-10
Overview:
In analyzing the technical indicators for LEV over the last 5 days, we will delve into the trend, momentum, volatility, and volume indicators to provide a comprehensive outlook on the possible stock price movement in the coming days. By examining these key aspects, we aim to offer valuable insights and predictions for informed decision-making.
Trend Analysis:
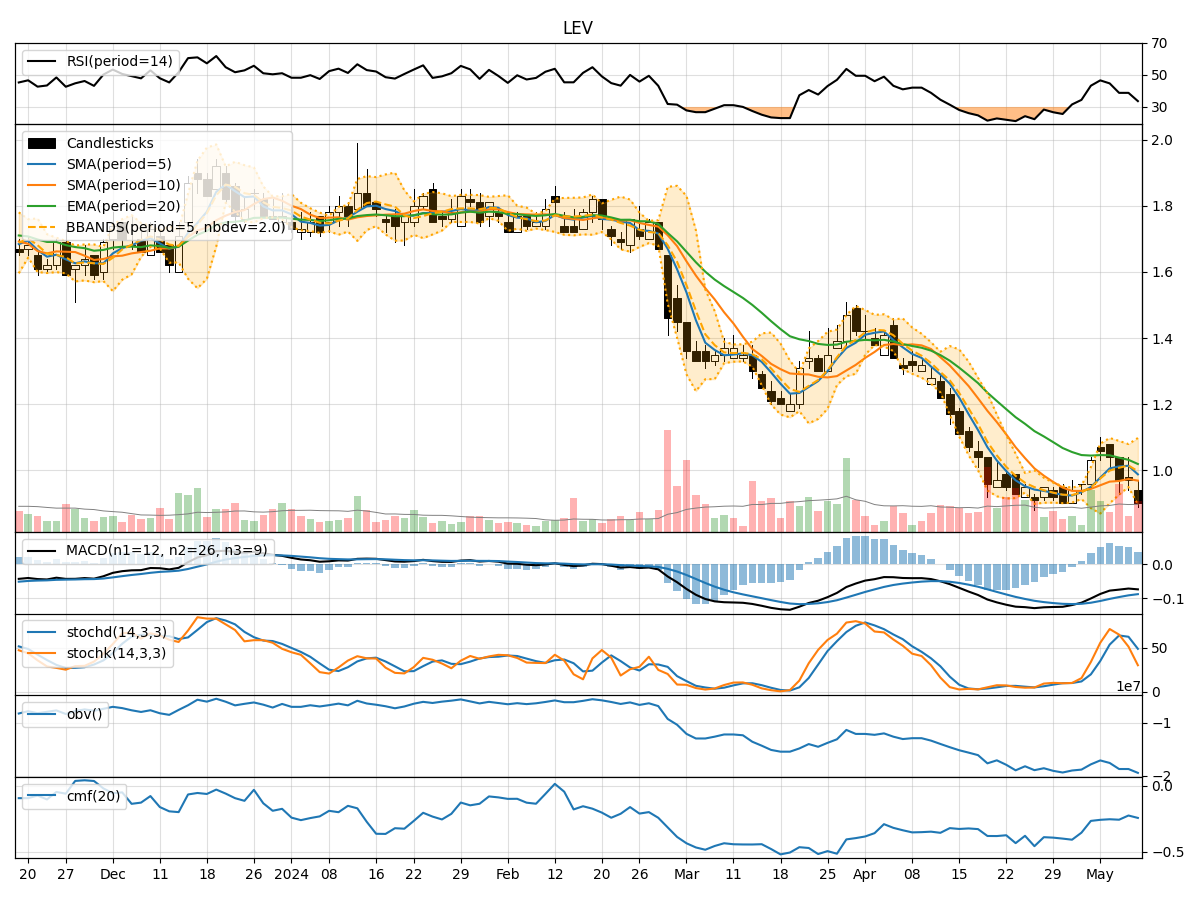
- Moving Averages (MA): The 5-day MA has been fluctuating around the closing prices, indicating short-term price trends. The stock has been below the 10-day Simple Moving Average (SMA), suggesting a bearish sentiment.
- Exponential Moving Average (EMA): The 20-day EMA has been declining, reflecting a downward trend in the stock price.
- Moving Average Convergence Divergence (MACD): The MACD line has been consistently below the signal line, indicating a bearish trend in momentum.
Momentum Analysis:
- Relative Strength Index (RSI): The RSI values have been decreasing, indicating weakening momentum and potential oversold conditions.
- Stochastic Oscillator: Both %K and %D values have been declining, suggesting a bearish momentum.
- Williams %R (Willams %R): The Williams %R values have been in the oversold territory, signaling a potential reversal or bounce.
Volatility Analysis:
- Bollinger Bands (BB): The stock price has been trading below the lower Bollinger Band, indicating oversold conditions and potential for a reversal.
Volume Analysis:
- On-Balance Volume (OBV): The OBV values have been consistently negative, indicating distribution and selling pressure.
- Chaikin Money Flow (CMF): The CMF values have been negative, suggesting outflow of money from the stock.
Key Observations:
- The stock is currently in a downtrend based on moving averages and MACD.
- Momentum indicators like RSI and Stochastic Oscillator suggest oversold conditions.
- Volatility indicators like Bollinger Bands indicate a potential reversal due to oversold conditions.
- Volume indicators show selling pressure and negative money flow.
Conclusion:
Based on the analysis of technical indicators, the next few days' possible stock price movement for LEV is likely to be sideways to slightly bullish. While the stock has been in a downtrend, the oversold conditions indicated by momentum and volatility indicators suggest a potential reversal or consolidation in the near term. Traders may consider monitoring for signs of a bullish reversal, such as a bounce off the lower Bollinger Band or a positive divergence in momentum indicators, before considering long positions.