Technical Analysis of LANV 2024-05-10
Overview:
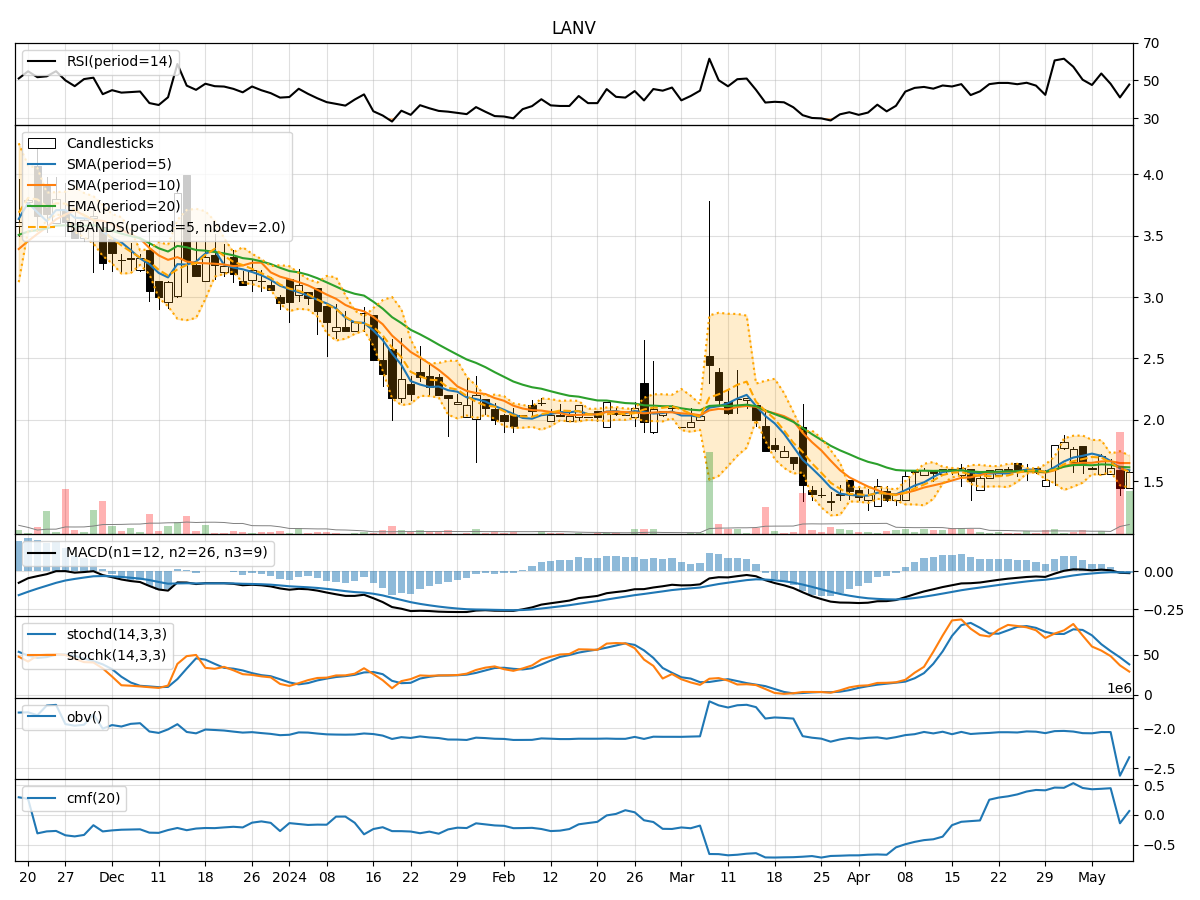
In analyzing the technical indicators for LANV over the last 5 days, we will delve into the trend, momentum, volatility, and volume indicators to provide a comprehensive outlook on the possible stock price movement in the coming days.
Trend Analysis:
- Moving Averages (MA): The 5-day MA has been below the closing prices, indicating a short-term downtrend.
- MACD: The MACD line has been consistently below the signal line, suggesting a bearish momentum.
- EMA: The EMA has been declining, reflecting a weakening trend.
Momentum Analysis:
- RSI: The RSI has been fluctuating around the 50 level, indicating indecision in the market.
- Stochastic Oscillator: Both %K and %D have been trending downwards, signaling a bearish momentum.
- Williams %R: The indicator has been in oversold territory, suggesting a potential reversal.
Volatility Analysis:
- Bollinger Bands: The stock price has been trading within the bands, indicating a period of consolidation.
- Bollinger %B: The %B indicator has been fluctuating around the midline, reflecting uncertainty in price direction.
Volume Analysis:
- On-Balance Volume (OBV): The OBV has been negative, indicating distribution of the stock.
- Chaikin Money Flow (CMF): The CMF has been below zero, suggesting selling pressure.
Key Observations:
- The stock is currently in a downtrend based on moving averages and MACD.
- Momentum indicators show a bearish sentiment with oversold conditions.
- Volatility indicators suggest a period of consolidation.
- Volume indicators point towards distribution and selling pressure.
Conclusion:
Based on the analysis of technical indicators, the outlook for LANV in the next few days is bearish. The stock is likely to continue its downward trend with potential for further downside movement. Traders should exercise caution and consider shorting opportunities or staying on the sidelines until a clearer trend emerges.