Technical Analysis of L 2024-05-10
Overview:
In analyzing the technical indicators for the last 5 days of stock data, we will delve into the trends, momentum, volatility, and volume indicators to provide a comprehensive outlook on the possible stock price movement for the next few days. By examining key metrics such as moving averages, MACD, RSI, Bollinger Bands, and OBV, we aim to offer valuable insights and recommendations for informed decision-making.
Trend Indicators Analysis:
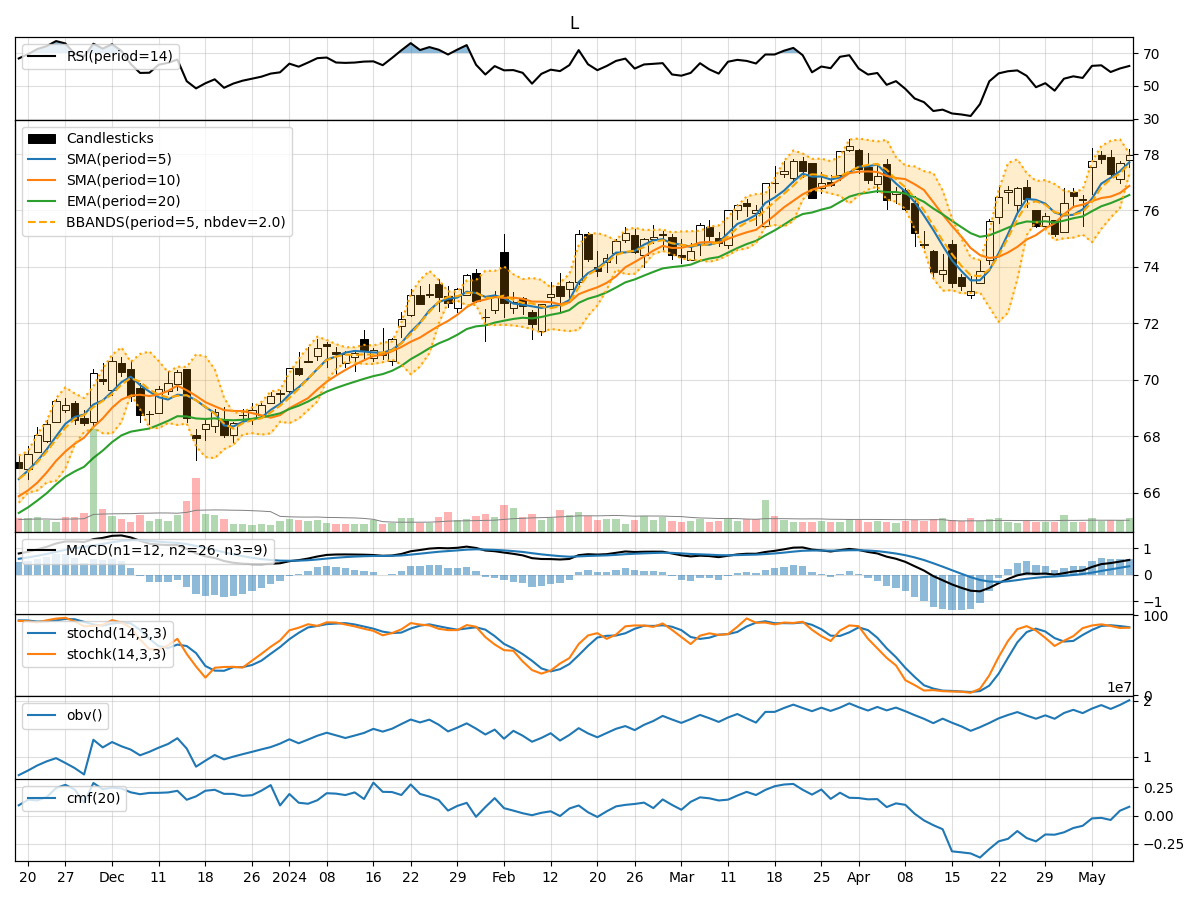
- Moving Averages (MA): The 5-day moving average has been consistently rising, indicating a bullish trend in the short term.
- MACD: The MACD line has been increasing, with the MACD histogram showing positive values, suggesting upward momentum.
- EMA: The exponential moving average has been trending upwards, supporting the bullish sentiment.
Momentum Indicators Analysis:
- RSI: The RSI has been in the neutral zone, indicating neither overbought nor oversold conditions.
- Stochastic Oscillator: Both %K and %D have been fluctuating but are not in extreme territories.
- Williams %R: The Williams %R is also within a neutral range, not signaling any extreme conditions.
Volatility Indicators Analysis:
- Bollinger Bands: The stock price has been trading within the Bollinger Bands, with the bands narrowing slightly, suggesting a potential decrease in volatility.
- Bollinger %B: The %B indicator is hovering around the middle, indicating a balanced market sentiment.
Volume Indicators Analysis:
- On-Balance Volume (OBV): The OBV has shown mixed movements, but the overall trend has been slightly positive, indicating accumulation.
- Chaikin Money Flow (CMF): The CMF has been negative, suggesting some selling pressure in the market.
Key Observations and Opinions:
- Trend: The stock is in an upward trend based on moving averages and MACD.
- Momentum: Momentum indicators suggest a neutral stance with no extreme overbought or oversold conditions.
- Volatility: Volatility is decreasing, as indicated by the narrowing Bollinger Bands.
- Volume: The volume indicators show mixed signals, with slight accumulation based on OBV.
Conclusion:
Based on the analysis of the technical indicators, the stock is likely to continue its upward trajectory in the next few days, supported by the bullish trend and positive momentum. The decreasing volatility may lead to a period of consolidation before potential further upside movement. Investors should consider maintaining a bullish outlook and monitor key support and resistance levels for potential entry or exit points.
Disclaimer:
This analysis is based solely on technical indicators and historical data, and actual market movements may vary. It is essential to conduct thorough research and consider other fundamental factors before making investment decisions. Consulting with a financial advisor is recommended for personalized guidance tailored to individual investment goals and risk tolerance levels.