Technical Analysis of KUKE 2024-05-10
Overview:
In analyzing the technical indicators for KUKE stock over the last 5 days, we will delve into the trend, momentum, volatility, and volume indicators to provide a comprehensive outlook on the possible future stock price movement. By examining these key indicators, we aim to offer valuable insights and predictions for the upcoming trading days.
Trend Indicators:
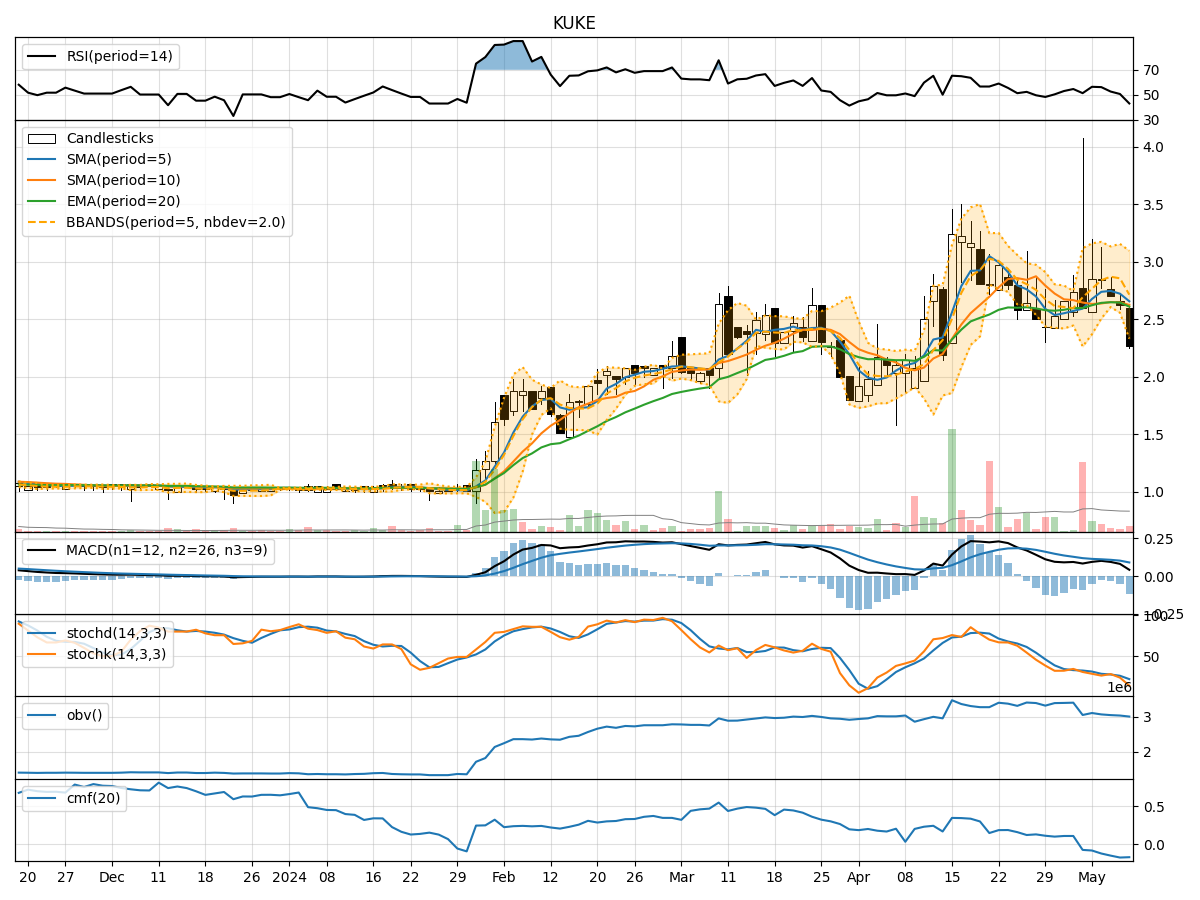
- Moving Averages (MA): The 5-day Moving Average (MA) has been fluctuating around the closing prices, indicating short-term price trends. The Simple Moving Average (SMA) and Exponential Moving Average (EMA) show a slight upward trend, albeit with some volatility.
- MACD: The Moving Average Convergence Divergence (MACD) and its signal line have been positive, suggesting a bullish momentum in the stock price.
- Conclusion: The trend indicators suggest a slightly bullish outlook for the stock in the short term.
Momentum Indicators:
- RSI: The Relative Strength Index (RSI) has been hovering around the mid-level, indicating a balanced momentum between buying and selling pressure.
- Stochastic Oscillator: Both %K and %D have been declining, signaling a potential oversold condition.
- Williams %R: The Williams %R is in the oversold territory, indicating a possible reversal in the stock price.
- Conclusion: The momentum indicators suggest a potential reversal in the stock's direction.
Volatility Indicators:
- Bollinger Bands: The Bollinger Bands are widening, indicating increased volatility in the stock price.
- Conclusion: The volatility indicators suggest heightened price fluctuations in the upcoming trading sessions.
Volume Indicators:
- On-Balance Volume (OBV): The OBV has been declining, indicating a divergence between volume and price movement.
- Chaikin Money Flow (CMF): The CMF is negative, suggesting a bearish sentiment in the stock.
- Conclusion: The volume indicators point towards bearish sentiment and a potential decrease in buying interest.
Overall Conclusion:
Based on the analysis of the trend, momentum, volatility, and volume indicators, the stock price of KUKE is likely to experience a short-term downward movement. The trend indicators show a slightly bullish outlook, but the momentum indicators signal a potential reversal and bearish sentiment. Additionally, the volatility indicators suggest increased price fluctuations, while the volume indicators indicate a lack of buying interest.
Therefore, considering all the technical indicators and their implications, it is recommended to exercise caution in trading KUKE stock in the next few days, as the overall sentiment leans towards a bearish bias.