Technical Analysis of KT 2024-05-10
Overview:
In analyzing the technical indicators for KT stock over the last 5 days, we will delve into the trend, momentum, volatility, and volume indicators to provide a comprehensive outlook on the possible stock price movement in the coming days. By examining these key indicators, we aim to offer valuable insights and predictions to guide your investment decisions.
Trend Analysis:
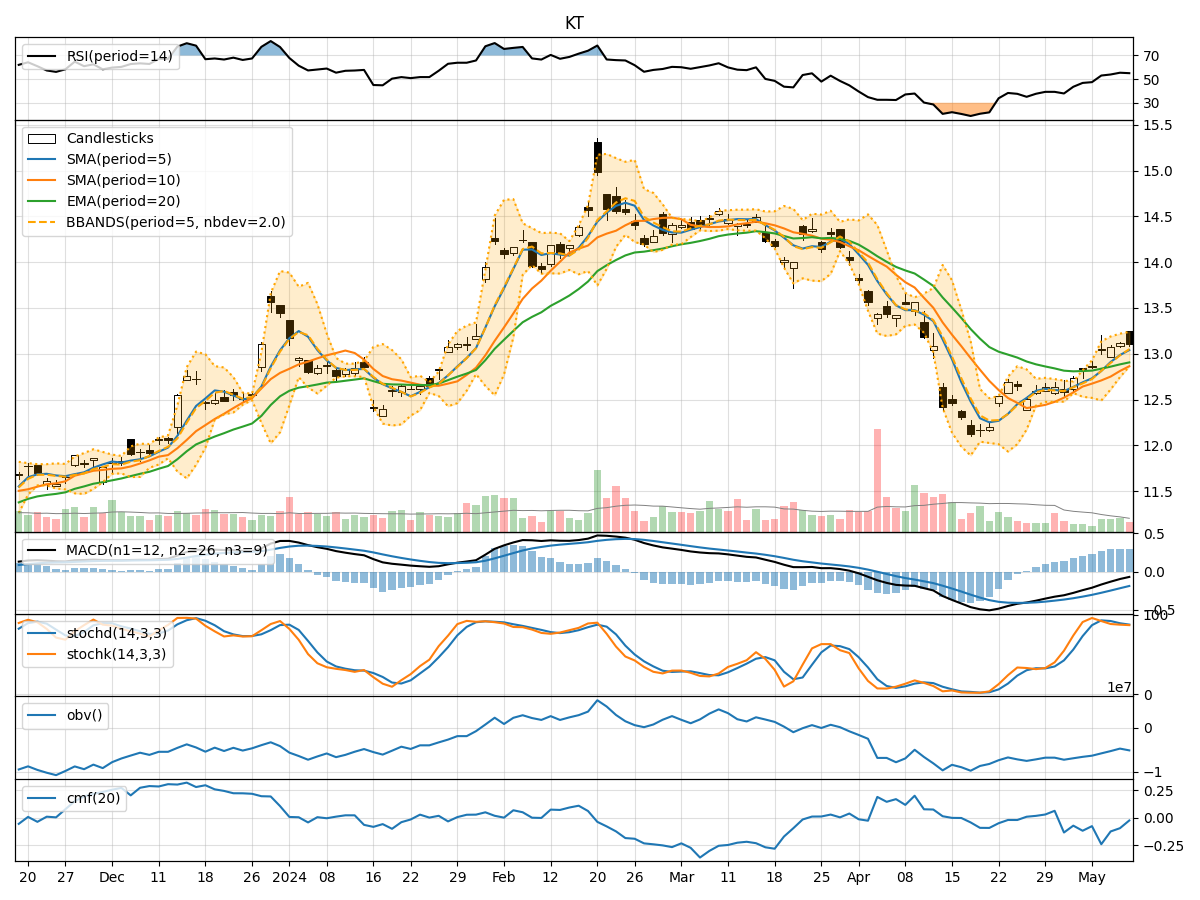
- Moving Averages (MA): The 5-day Moving Average (MA) has been consistently above the Simple Moving Average (SMA) and Exponential Moving Average (EMA), indicating a bullish trend.
- MACD: The Moving Average Convergence Divergence (MACD) has been negative but showing signs of convergence towards the signal line, suggesting a potential trend reversal.
- Conclusion: The trend is bullish but with a possibility of a reversal in the near future.
Momentum Analysis:
- RSI: The Relative Strength Index (RSI) has been fluctuating around the neutral zone, indicating indecision in the market.
- Stochastic Oscillator: Both %K and %D have been declining, signaling a potential bearish momentum.
- Conclusion: Momentum is neutral to bearish, with a slight inclination towards a bearish sentiment.
Volatility Analysis:
- Bollinger Bands (BB): The stock price has been trading within the bands, suggesting a period of consolidation.
- Conclusion: Volatility is low, indicating a sideways movement in the stock price.
Volume Analysis:
- On-Balance Volume (OBV): The OBV has been decreasing, indicating selling pressure in the market.
- Chaikin Money Flow (CMF): The CMF has been negative, reflecting a lack of buying interest.
- Conclusion: Volume indicators suggest a bearish sentiment in the market.
Conclusion:
Based on the analysis of trend, momentum, volatility, and volume indicators, the overall outlook for KT stock in the next few days is bearish. The trend is currently bullish but showing signs of a potential reversal, while momentum is neutral to bearish. Volatility is low, indicating a sideways movement, and volume indicators point towards selling pressure and a lack of buying interest.
Recommendation:
Considering the bearish outlook, it is advisable to exercise caution when trading KT stock in the coming days. Investors may consider implementing risk management strategies and closely monitoring key support levels for potential entry or exit points. It is essential to stay informed about any market developments that could impact the stock price movement.
Disclaimer:
Please note that technical analysis is not a guaranteed predictor of future price movements, and other fundamental factors can influence stock prices. It is crucial to conduct thorough research and consider multiple indicators before making any investment decisions. Consulting with a financial advisor is recommended for personalized investment advice tailored to your specific financial goals and risk tolerance level.