Technical Analysis of KR 2024-05-10
Overview:
In analyzing the technical indicators for KR over the last 5 days, we will delve into the trend, momentum, volatility, and volume indicators to provide a comprehensive outlook on the possible stock price movement in the coming days. By examining these key aspects, we aim to offer valuable insights and predictions to guide your investment decisions.
Trend Indicators:
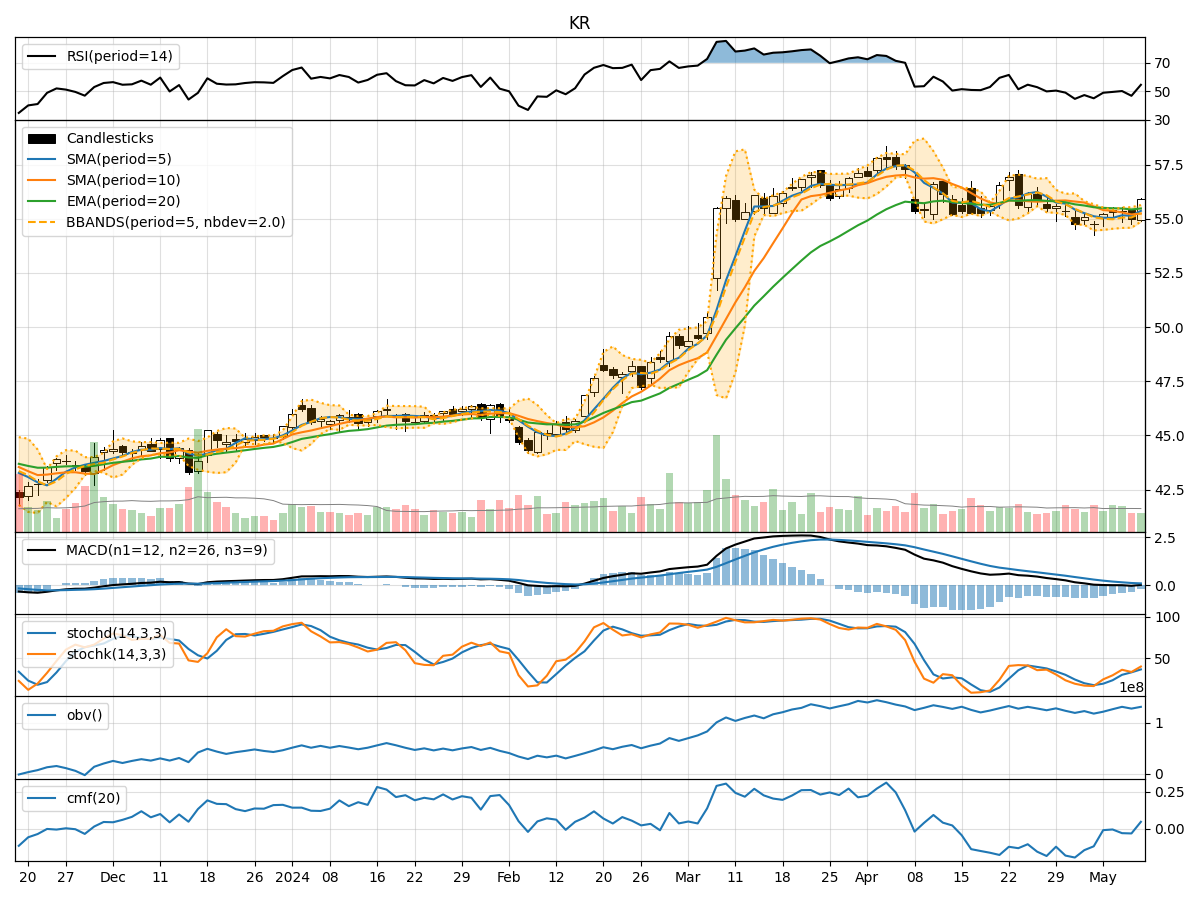
- Moving Averages (MA): The 5-day Moving Average (MA) has been fluctuating around the closing prices, indicating short-term price trends. The Simple Moving Average (SMA) and Exponential Moving Average (EMA) show a slight convergence but remain close to the current price levels.
- MACD: The Moving Average Convergence Divergence (MACD) and its signal line (MACDH) have been hovering around the zero line, suggesting a lack of strong momentum in either direction.
Momentum Indicators:
- RSI: The Relative Strength Index (RSI) has shown mixed signals, fluctuating around the neutral 50 level, indicating indecision in the market.
- Stochastic Oscillator: Both %K and %D lines of the Stochastic Oscillator have been moving upwards but remain below the overbought threshold, suggesting a potential uptrend but not yet in an overbought condition.
Volatility Indicators:
- Bollinger Bands (BB): The Bollinger Bands have widened slightly, indicating increased volatility in the stock price. The bands have not shown any significant squeeze or expansion, suggesting a neutral volatility outlook.
- Bollinger %B: The %B indicator is currently below 1, indicating that the stock price is trading below the upper Bollinger Band, potentially signaling a short-term pullback.
Volume Indicators:
- On-Balance Volume (OBV): The OBV has shown mixed movements, indicating no clear accumulation or distribution pattern in the stock.
- Chaikin Money Flow (CMF): The CMF has been negative, suggesting that money flow has been predominantly negative over the past 20 days.
Key Observations and Opinions:
- Trend: The trend indicators suggest a lack of clear direction in the stock price, with moving averages and MACD signaling a neutral stance.
- Momentum: Momentum indicators show mixed signals, with RSI hovering around 50 and Stochastic Oscillator indicating a potential uptrend but not yet overbought.
- Volatility: Volatility indicators point towards increased volatility but without a clear trend bias.
- Volume: Volume indicators reflect indecision in the market, with OBV and CMF showing mixed signals.
Conclusion:
Based on the analysis of the technical indicators, the next few days for KR stock price movement could be sideways with a slight upward bias. The lack of strong trends in the trend and momentum indicators, coupled with mixed signals in volatility and volume, suggests a period of consolidation or range-bound trading. Investors may expect the stock price to fluctuate within a narrow range without a clear directional bias. It is advisable to closely monitor key support and resistance levels for potential breakout or breakdown scenarios.