Technical Analysis of KIM 2024-05-10
Overview:
In analyzing the technical indicators for KIM stock over the last 5 days, we will delve into the trend, momentum, volatility, and volume indicators to provide a comprehensive outlook on the possible future stock price movement. By examining these key indicators, we aim to offer valuable insights and recommendations for potential investors.
Trend Analysis:
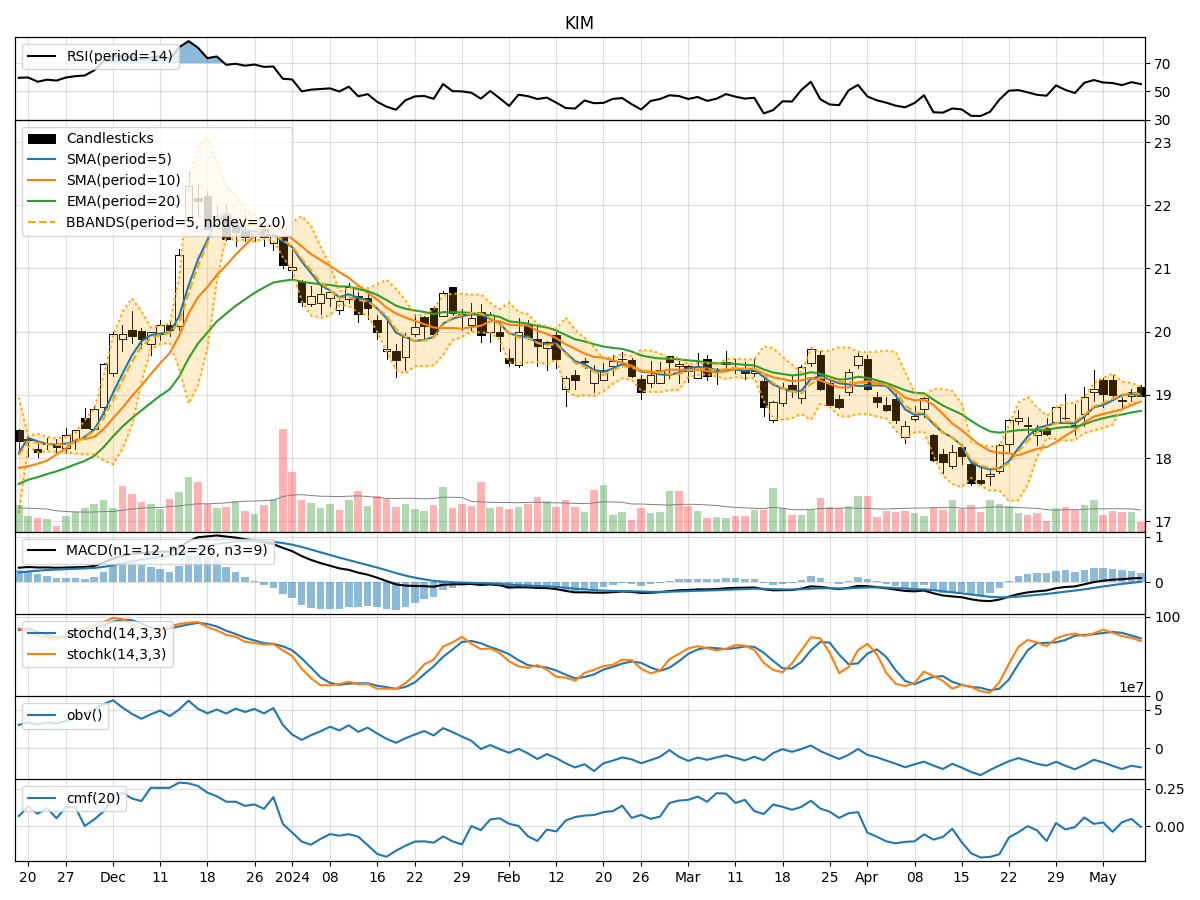
- Moving Averages (MA): The 5-day Moving Average (MA) has been consistently above the Simple Moving Average (SMA) and Exponential Moving Average (EMA), indicating a bullish trend.
- MACD: The MACD line has been above the signal line for the past few days, suggesting a positive momentum in the stock price.
Momentum Analysis:
- RSI: The Relative Strength Index (RSI) has been fluctuating around the 50 level, indicating a neutral momentum in the stock.
- Stochastic Oscillator: Both %K and %D have been gradually decreasing, signaling a potential bearish momentum.
Volatility Analysis:
- Bollinger Bands (BB): The stock price has been trading within the Bollinger Bands, with the bands narrowing, suggesting a period of low volatility.
Volume Analysis:
- On-Balance Volume (OBV): The OBV has shown mixed signals, with alternating positive and negative values, indicating indecision among investors.
- Chaikin Money Flow (CMF): The CMF has been fluctuating around the zero line, reflecting a lack of strong buying or selling pressure.
Key Observations:
- The trend indicators suggest a bullish sentiment in the short term.
- Momentum indicators show a neutral to slightly bearish outlook.
- Volatility indicators point towards a period of low volatility.
- Volume indicators indicate indecision among market participants.
Conclusion:
Based on the analysis of the technical indicators, the next few days for KIM stock are likely to see sideways movement with a slight bearish bias. Investors should exercise caution and closely monitor the price action for any potential breakout or reversal signals. It is advisable to wait for more clarity in the market dynamics before making significant trading decisions.