Technical Analysis of KEP 2024-05-10
Overview:
In analyzing the technical indicators for KEP over the last 5 days, we will delve into the trend, momentum, volatility, and volume indicators to provide a comprehensive outlook on the possible stock price movement in the coming days. By examining these key indicators, we aim to offer valuable insights and predictions for potential investors.
Trend Analysis:
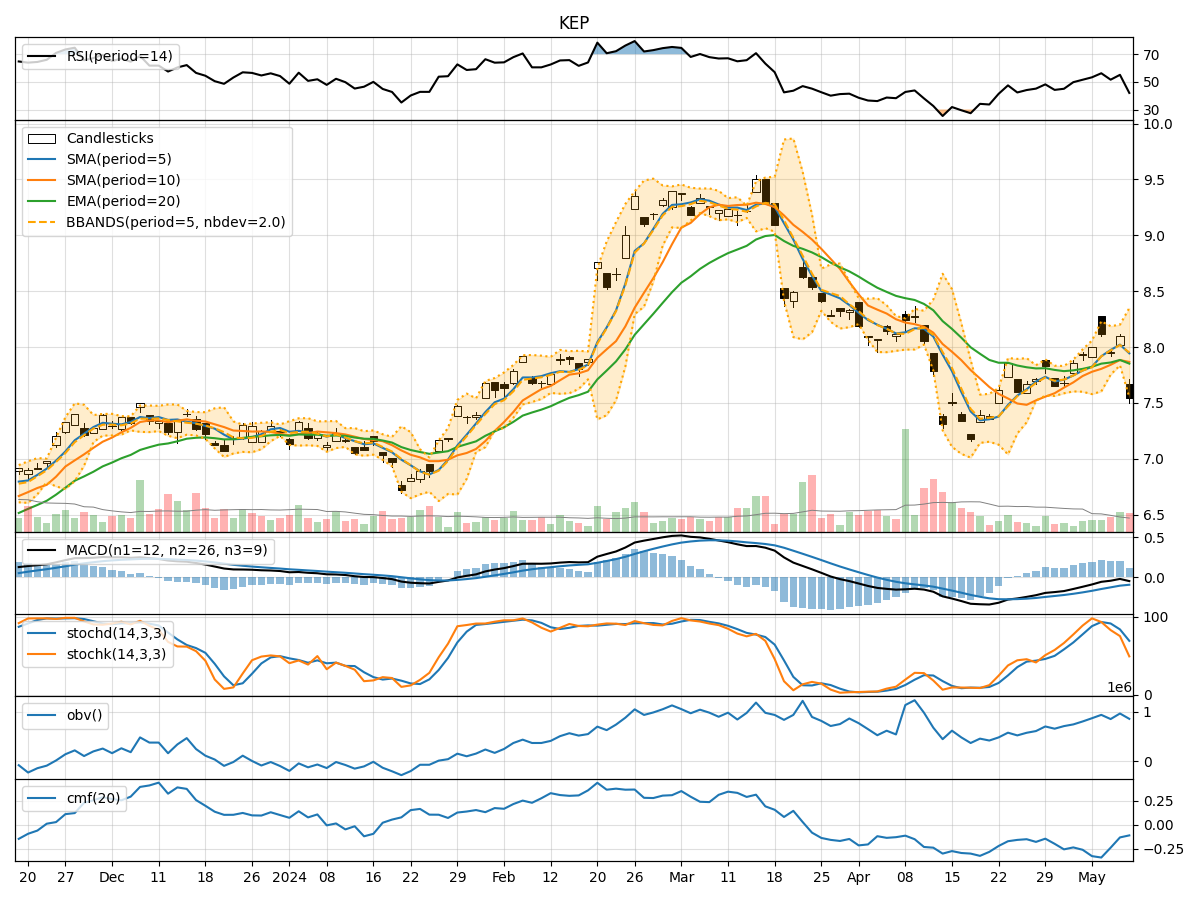
- Moving Averages (MA): The 5-day Moving Average (MA) has been fluctuating around the closing prices, indicating short-term price trends. The Simple Moving Average (SMA) and Exponential Moving Average (EMA) show a slight divergence, suggesting potential volatility.
- MACD and Signal Line: The MACD has been negative, but the MACD Histogram has shown some positive movements, indicating a possible reversal in the short term.
Momentum Analysis:
- RSI: The Relative Strength Index (RSI) has been fluctuating around the midline, indicating indecision in the market.
- Stochastic Oscillator: Both %K and %D have been declining, suggesting a bearish momentum.
- Williams %R: The Williams %R is in oversold territory, indicating a potential buying opportunity.
Volatility Analysis:
- Bollinger Bands (BB): The Bollinger Bands have widened, indicating increased volatility in the stock price.
- Bollinger %B: The %B is near the lower band, suggesting a possible oversold condition.
Volume Analysis:
- On-Balance Volume (OBV): The OBV has been fluctuating, indicating mixed buying and selling pressure.
- Chaikin Money Flow (CMF): The CMF has been negative, indicating a lack of buying interest.
Key Observations:
- The trend indicators show a potential for volatility in the short term.
- Momentum indicators suggest a bearish sentiment in the market.
- Volatility indicators point towards increased price fluctuations.
- Volume indicators reflect mixed trading activity with a slight negative bias.
Conclusion:
Based on the analysis of the technical indicators, the stock price of KEP is likely to experience further downward movement in the coming days. The bearish momentum, coupled with increased volatility and mixed volume signals, indicates a challenging environment for the stock. Investors should exercise caution and consider waiting for more favorable conditions before entering or adding to positions.