Technical Analysis of KB 2024-05-10
Overview:
In analyzing the provided technical indicators for KB stock over the last 5 days, we will delve into the trend, momentum, volatility, and volume indicators to derive insights into the possible future stock price movement. By examining these key aspects, we aim to provide a comprehensive and well-informed prediction for the upcoming trading days.
Trend Analysis:
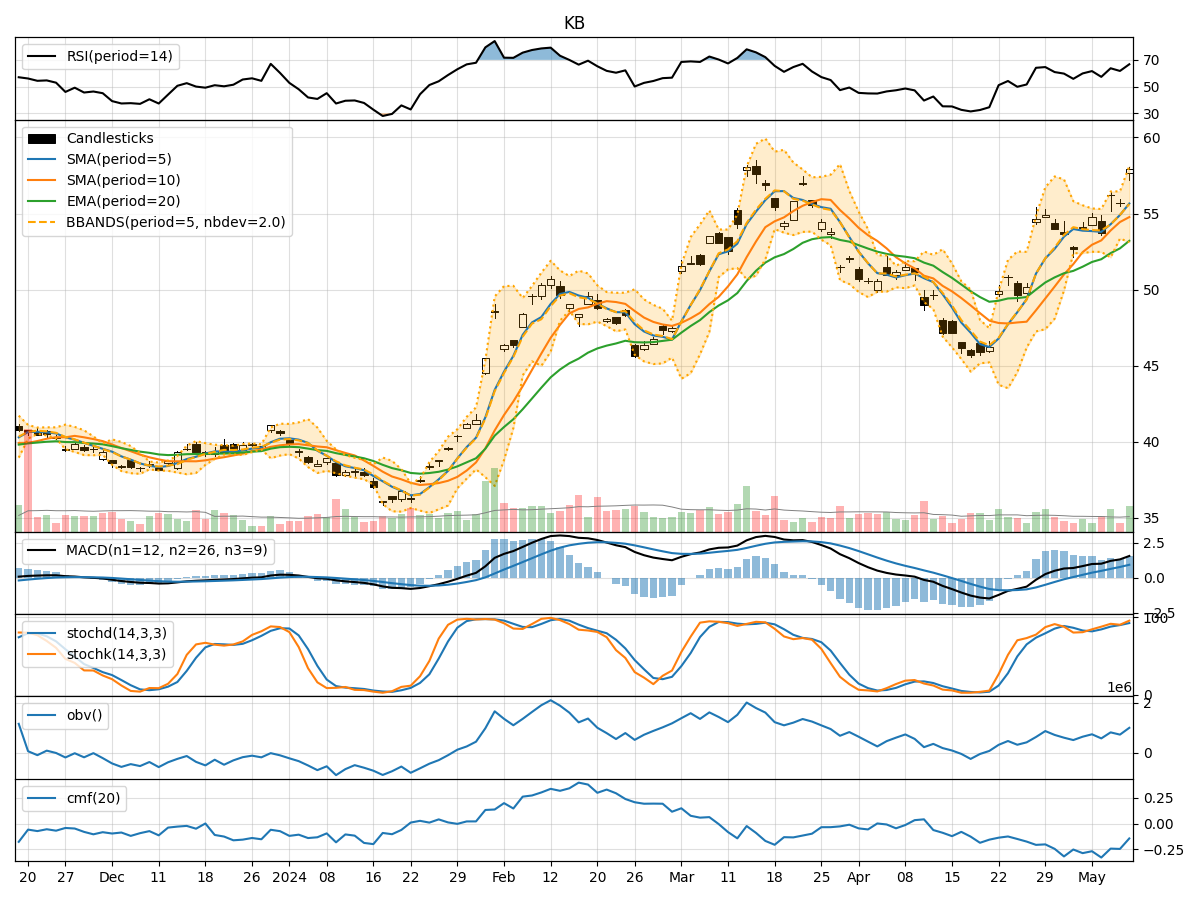
- Moving Averages (MA): The 5-day Moving Average (MA) has been consistently rising, indicating a bullish trend in the short term.
- MACD: The MACD line has been increasing, crossing above the signal line, suggesting a strengthening bullish momentum.
- Relative Strength Index (RSI): The RSI has been fluctuating in the overbought region, indicating a strong buying pressure.
Momentum Analysis:
- Stochastic Oscillator: Both %K and %D lines of the Stochastic Oscillator are in the overbought zone, signaling a potential reversal or consolidation.
- Williams %R (WillR): The Williams %R is hovering near oversold levels, suggesting a possible buying opportunity.
Volatility Analysis:
- Bollinger Bands (BB): The stock price has been trading near the upper Bollinger Band, indicating high volatility and a potential overbought condition.
- Bollinger Band Width (BBW): The BBW has been expanding, suggesting increased price volatility.
Volume Analysis:
- On-Balance Volume (OBV): The OBV has been fluctuating, indicating mixed buying and selling pressure.
- Chaikin Money Flow (CMF): The CMF has been negative, suggesting a lack of strong buying interest.
Key Observations:
- The trend indicators suggest a bullish sentiment in the short term.
- Momentum indicators show signs of potential overbought conditions and a need for caution.
- Volatility indicators point towards increased price fluctuations and a possible correction.
- Volume indicators reflect mixed market participation and lack of strong buying pressure.
Conclusion:
Based on the analysis of the technical indicators, the next few days for KB stock may see a potential consolidation or pullback. While the trend remains bullish in the short term, the overbought signals from momentum indicators and high volatility levels indicate a need for caution. Traders should closely monitor key support and resistance levels for potential entry or exit points. Exercise patience and wait for clearer signals before making significant trading decisions.