Technical Analysis of K 2024-05-10
Overview:
In analyzing the provided technical indicators for the last 5 days, we will delve into the trend, momentum, volatility, and volume indicators to forecast the possible stock price movement for the next few days. By examining these key aspects, we aim to provide a comprehensive and insightful prediction backed by data-driven analysis.
Trend Indicators:
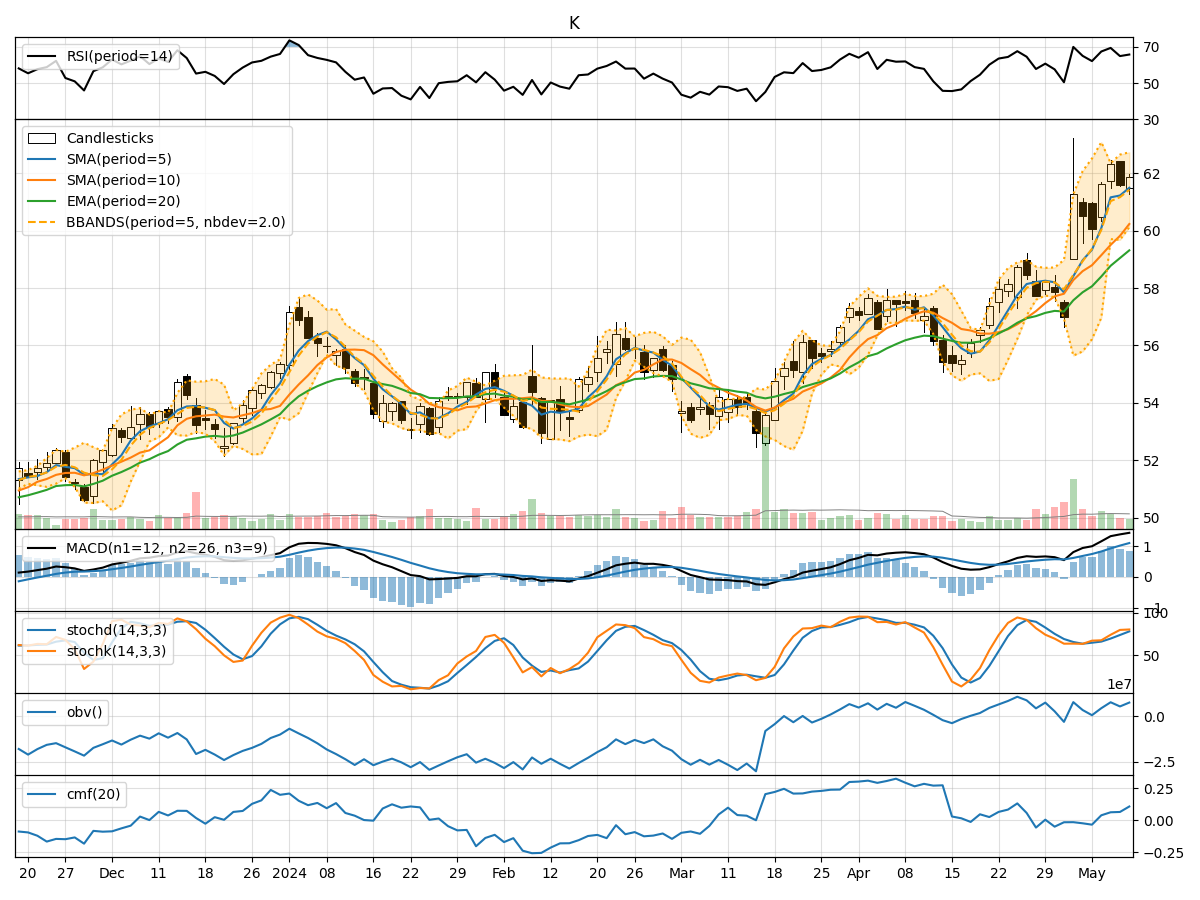
- Moving Averages (MA): The moving averages have been on an upward trend, indicating a positive momentum in the stock price.
- MACD and Signal Line: The MACD has been consistently above the signal line, suggesting a bullish trend.
- Relative Strength Index (RSI): The RSI values have been in the overbought territory, indicating a strong bullish momentum.
- Conclusion: The trend indicators point towards a bullish outlook for the stock price.
Momentum Indicators:
- Stochastic Oscillator: Both %K and %D have been in the overbought zone, signaling a strong buying momentum.
- Williams %R (WillR): The Williams %R is also in the oversold region, indicating a potential reversal.
- Conclusion: Momentum indicators support a bullish sentiment for the stock.
Volatility Indicators:
- Bollinger Bands (BB): The stock price has been trading within the upper Bollinger Band, suggesting an increased volatility.
- Conclusion: Volatility indicators imply a volatile market environment for the stock.
Volume Indicators:
- On-Balance Volume (OBV): The OBV has shown an overall increase, indicating accumulation by investors.
- Chaikin Money Flow (CMF): The CMF has been positive, reflecting buying pressure in the stock.
- Conclusion: Volume indicators suggest a bullish sentiment in the stock.
Conclusion:
Based on the analysis of trend, momentum, volatility, and volume indicators, the overall outlook for the stock is bullish. The stock is likely to experience further upward movement in the coming days, supported by strong buying momentum, positive trend indicators, and increasing volume accumulation. Traders and investors may consider taking long positions or holding onto existing positions to benefit from the anticipated price appreciation.
Disclaimer:
This analysis is based solely on technical indicators and historical data, and it is important to consider other fundamental factors and market dynamics before making any investment decisions. It is recommended to conduct thorough research and consult with a financial advisor to align investment strategies with individual goals and risk tolerance levels.