Technical Analysis of JHX 2024-05-10
Overview:
In analyzing the technical indicators for JHX over the last 5 days, we will delve into the trend, momentum, volatility, and volume indicators to provide a comprehensive outlook on the possible stock price movement in the coming days. By examining these key aspects, we aim to offer valuable insights and predictions for informed decision-making.
Trend Analysis:
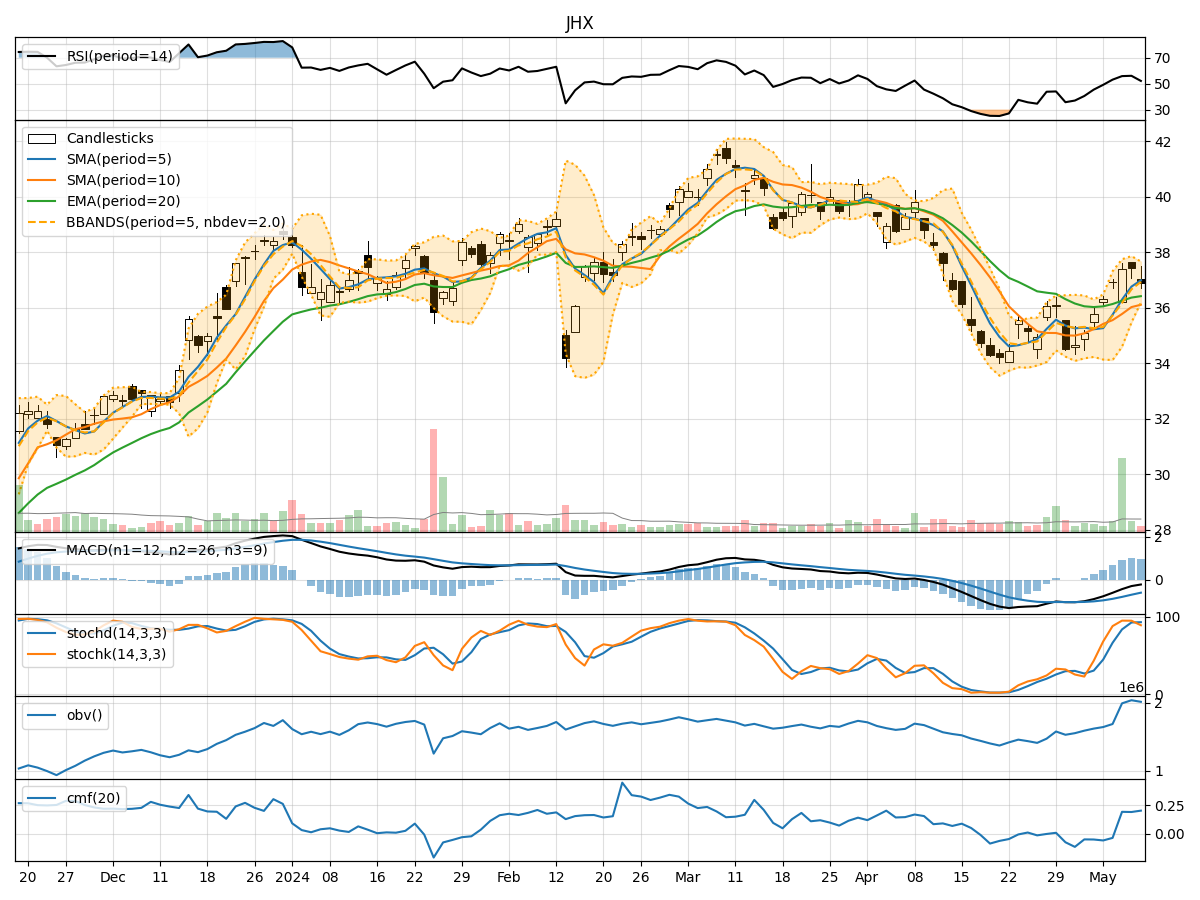
- Moving Averages (MA): The 5-day MA has been showing an upward trend, indicating a positive momentum in the stock price.
- MACD: The MACD line has been consistently below the signal line, suggesting a bearish trend in the short term.
- RSI: The RSI has been fluctuating around the neutral zone, indicating a balanced momentum in the stock.
Momentum Analysis:
- Stochastic Oscillator: Both %K and %D have been in the overbought territory, signaling a potential reversal or consolidation phase.
- Williams %R: The Williams %R is in the oversold region, indicating a possible buying opportunity in the stock.
Volatility Analysis:
- Bollinger Bands (BB): The stock price has been trading within the bands, suggesting a period of consolidation or range-bound movement.
- Average True Range (ATR): The ATR has shown a slight increase, indicating a potential rise in volatility in the coming days.
Volume Analysis:
- On-Balance Volume (OBV): The OBV has been fluctuating, indicating mixed sentiment among investors regarding the stock.
- Chaikin Money Flow (CMF): The CMF has been positive, suggesting a net inflow of money into the stock.
Key Observations:
- The stock is currently in a consolidation phase, as indicated by the sideways movement in the price and the mixed signals from various indicators.
- The momentum indicators suggest a potential reversal or a period of indecision among market participants.
- Volatility is expected to increase slightly, which could lead to more significant price swings in the near future.
- The volume indicators reflect a neutral sentiment, with no clear direction in terms of investor participation.
Conclusion:
Based on the analysis of the technical indicators, the next few days for JHX are likely to see sideways movement with a slight increase in volatility. The stock may enter a consolidation phase as it seeks direction amidst mixed signals from the indicators. Investors should exercise caution and wait for clearer signals before making significant trading decisions.