Technical Analysis of JHG 2024-05-10
Overview:
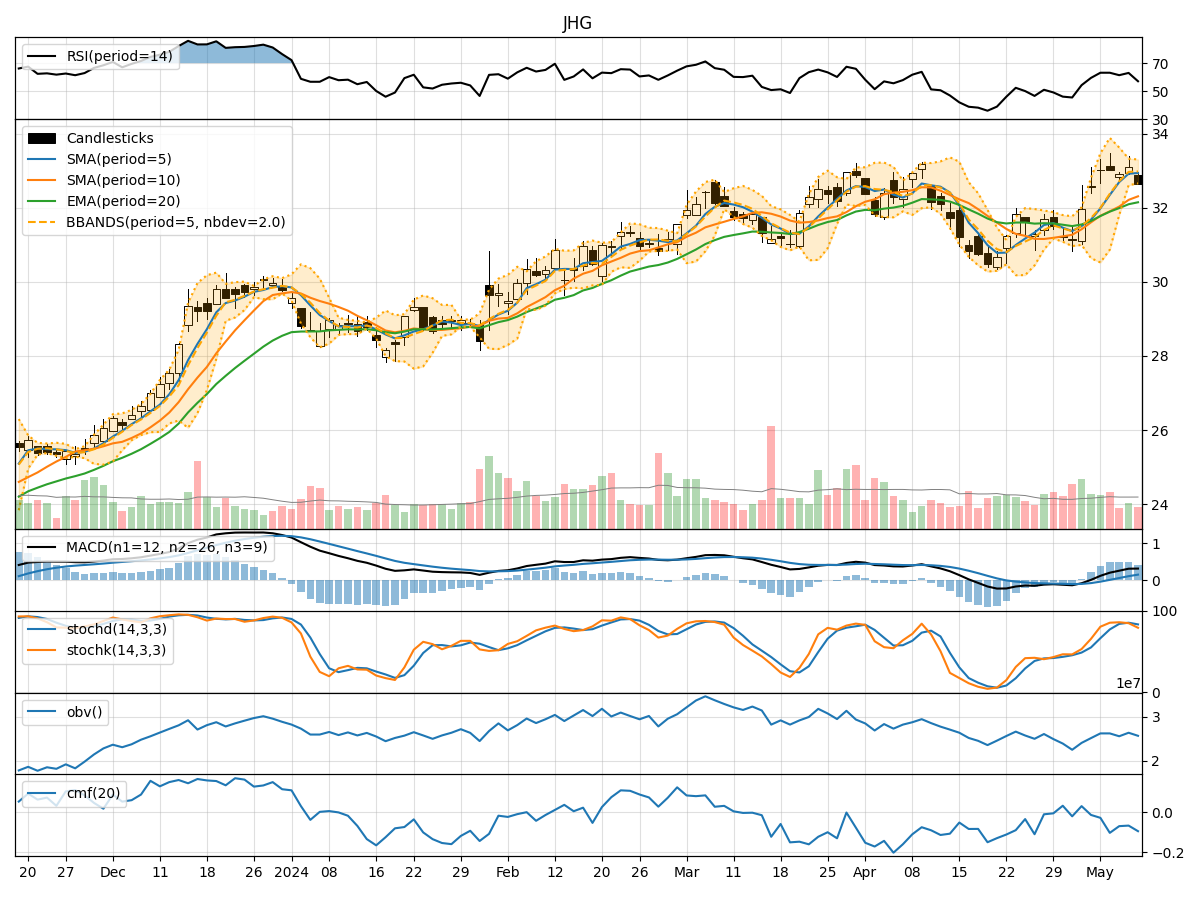
In analyzing the technical indicators for JHG over the last 5 days, we will delve into the trend, momentum, volatility, and volume indicators to provide a comprehensive outlook on the possible stock price movement in the coming days. By examining these key aspects, we aim to offer valuable insights and predictions to guide investment decisions.
Trend Analysis:
- Moving Averages (MA): The 5-day Moving Average (MA) has been consistently above the Simple Moving Average (SMA) and Exponential Moving Average (EMA), indicating a bullish trend.
- MACD: The MACD line has been consistently above the signal line, with the MACD histogram showing an increasing positive trend, suggesting bullish momentum.
Momentum Analysis:
- RSI: The Relative Strength Index (RSI) has been hovering around 60-65, indicating a neutral to slightly bullish momentum.
- Stochastic Oscillator: Both %K and %D lines of the Stochastic Oscillator have been in the overbought zone, suggesting a potential reversal or consolidation.
Volatility Analysis:
- Bollinger Bands (BB): The stock price has been trading within the Bollinger Bands, with the bands narrowing, indicating decreasing volatility.
- Bollinger %B: The %B indicator has been fluctuating around 0.5, suggesting the stock is trading near the middle band.
Volume Analysis:
- On-Balance Volume (OBV): The OBV has shown a mixed trend, indicating some distribution of shares.
- Chaikin Money Flow (CMF): The CMF has been negative, suggesting a slight outflow of money from the stock.
Key Observations:
- The trend indicators point towards a bullish sentiment, supported by the MACD and moving averages.
- Momentum indicators show a neutral to slightly bullish stance, with the RSI indicating room for further upside.
- Volatility has been decreasing, potentially signaling a period of consolidation or a calm before a potential move.
- Volume indicators suggest some distribution of shares, which could impact price movement.
Conclusion:
Based on the analysis of the technical indicators, the stock price of JHG is likely to experience further upside movement in the coming days. The bullish trend supported by moving averages and MACD, coupled with neutral to slightly bullish momentum, indicates a positive outlook. However, the overbought Stochastic Oscillator and mixed volume indicators suggest a potential for consolidation or a minor pullback before resuming the upward trend. Traders and investors should monitor key levels and be prepared for potential price fluctuations.