Technical Analysis of J 2024-05-10
Overview:
In analyzing the technical indicators for the stock J over the last 5 days, we will delve into the trend, momentum, volatility, and volume indicators to provide a comprehensive outlook on the possible stock price movement in the coming days. By examining these key indicators, we aim to offer valuable insights and predictions to guide your investment decisions.
Trend Analysis:
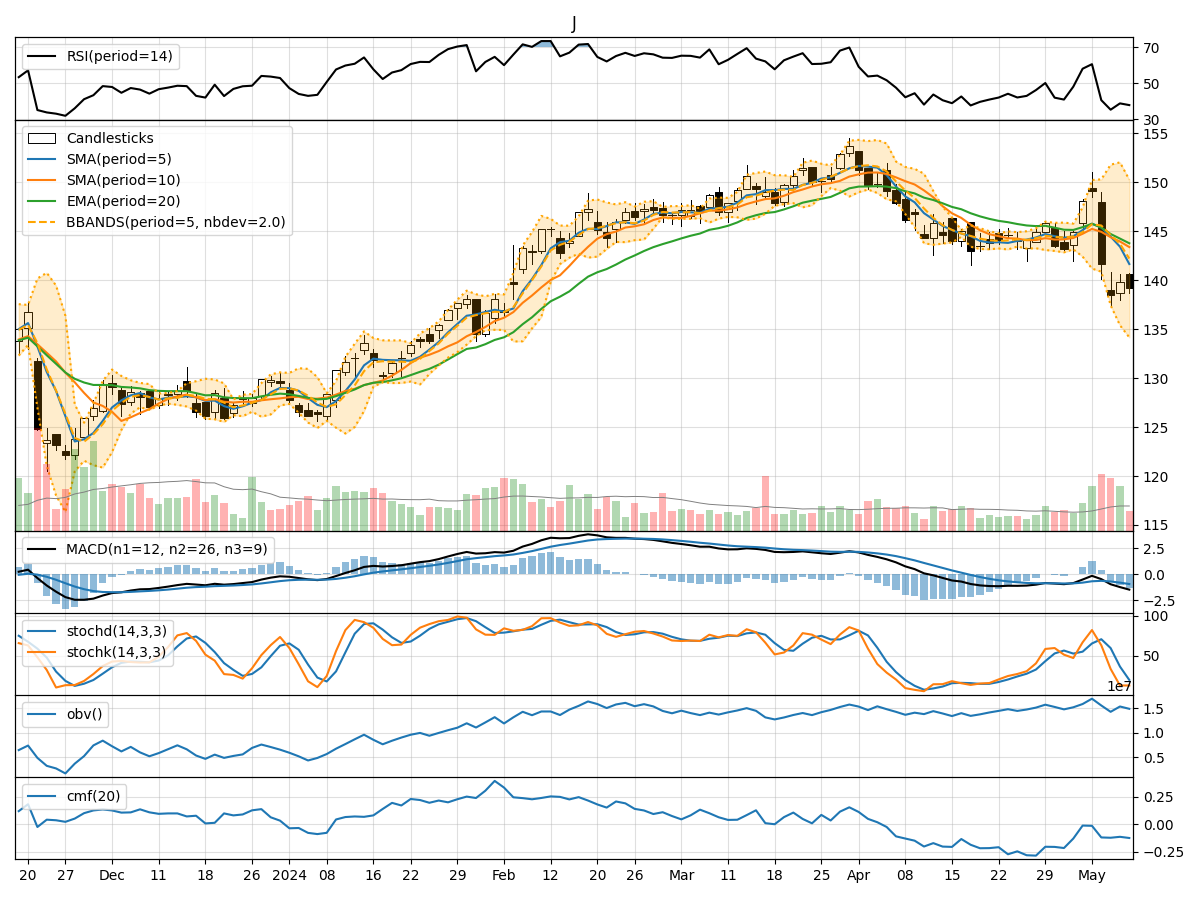
- Moving Averages (MA): The 5-day Moving Average (MA) has been consistently decreasing, indicating a downward trend in the stock price.
- MACD: The Moving Average Convergence Divergence (MACD) is negative and decreasing, suggesting bearish momentum in the stock.
- EMA: The Exponential Moving Average (EMA) is also trending downwards, reinforcing the bearish sentiment in the stock.
Momentum Analysis:
- RSI: The Relative Strength Index (RSI) is below 50, indicating a bearish momentum in the stock.
- Stochastic Oscillator: Both %K and %D are in oversold territory, signaling a potential reversal or continuation of the downtrend.
- Williams %R: The Williams %R is in oversold territory, suggesting a possible bounce back in the stock price.
Volatility Analysis:
- Bollinger Bands: The Bollinger Bands are narrowing, indicating decreasing volatility in the stock.
- Bollinger %B: The %B is below 1, suggesting the stock is trading below the lower Bollinger Band, potentially indicating an oversold condition.
Volume Analysis:
- On-Balance Volume (OBV): The OBV has been decreasing, indicating selling pressure in the stock.
- Chaikin Money Flow (CMF): The CMF is negative, suggesting outflow of money from the stock.
Key Observations:
- The stock J is currently in a downtrend based on the moving averages and MACD.
- Momentum indicators like RSI and Stochastic Oscillator are signaling bearish momentum.
- Volatility is decreasing, potentially leading to a period of consolidation.
- Volume indicators show selling pressure with a negative OBV and CMF.
Conclusion:
Based on the analysis of the technical indicators, the next few days for stock J are likely to see a continuation of the downward trend with bearish momentum. Traders and investors should exercise caution and consider waiting for signs of a potential reversal before considering long positions. The stock may experience further downside movement before stabilizing. It is advisable to closely monitor key support levels and wait for confirmation of a trend reversal before considering any bullish positions.