Technical Analysis of IX 2024-05-10
Overview:
In analyzing the technical indicators for the stock over the last 5 days, we will delve into the trend, momentum, volatility, and volume indicators to provide a comprehensive outlook on the possible stock price movement in the coming days. By examining these key indicators, we aim to offer valuable insights and predictions for potential investors.
Trend Analysis:
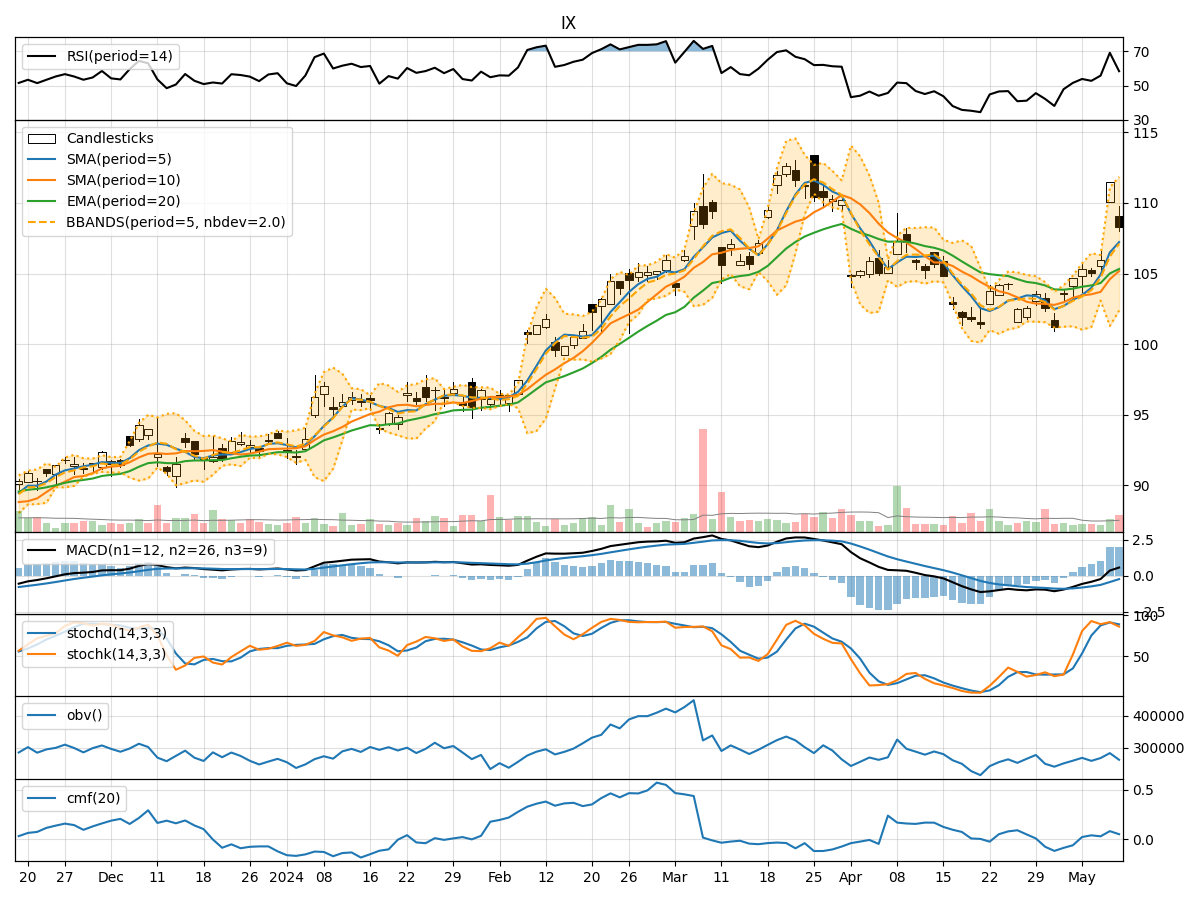
- Moving Averages (MA): The 5-day Moving Average (MA) has been consistently rising, indicating a bullish trend in the short term.
- MACD: The Moving Average Convergence Divergence (MACD) has shown positive values, suggesting upward momentum.
- RSI: The Relative Strength Index (RSI) has been fluctuating but generally staying within the neutral range, indicating a balanced market sentiment.
Momentum Analysis:
- Stochastic Oscillator: Both %K and %D values have been relatively high, signaling potential overbought conditions.
- Williams %R: The Williams %R indicator has been in the oversold territory, suggesting a possible reversal in the short term.
Volatility Analysis:
- Bollinger Bands: The Bollinger Bands have widened, indicating increased volatility in the stock price.
- Bollinger %B: The %B value has been fluctuating within a moderate range, reflecting mixed market sentiment.
Volume Analysis:
- On-Balance Volume (OBV): The OBV has shown mixed movements, indicating indecision among investors.
- Chaikin Money Flow (CMF): The CMF has been positive but relatively low, suggesting some buying pressure.
Key Observations:
- The stock is currently in an upward trend based on moving averages and MACD.
- Momentum indicators suggest a potential overbought condition in the short term.
- Volatility has increased, indicating higher price fluctuations.
- Volume indicators show mixed investor sentiment with some buying pressure.
Conclusion:
Based on the analysis of the technical indicators, the stock is likely to experience further upward movement in the coming days, driven by the bullish trend and positive momentum. However, caution is advised due to the potential overbought conditions and increased volatility. Investors should closely monitor the price action and consider setting appropriate stop-loss levels to manage risks effectively.
Recommendation:
- Short-term traders: Consider taking profits as the stock may be overbought.
- Long-term investors: Hold positions but remain vigilant for potential reversals.
- Risk management: Implement stop-loss orders to protect gains and manage downside risk effectively.
By combining technical analysis with prudent risk management strategies, investors can navigate the market dynamics with confidence and make informed decisions aligned with their investment goals.