Technical Analysis of IRM 2024-05-10
Overview:
In analyzing the technical indicators for IRM over the last 5 days, we will delve into the trend, momentum, volatility, and volume indicators to provide a comprehensive outlook on the possible stock price movement in the coming days.
Trend Analysis:
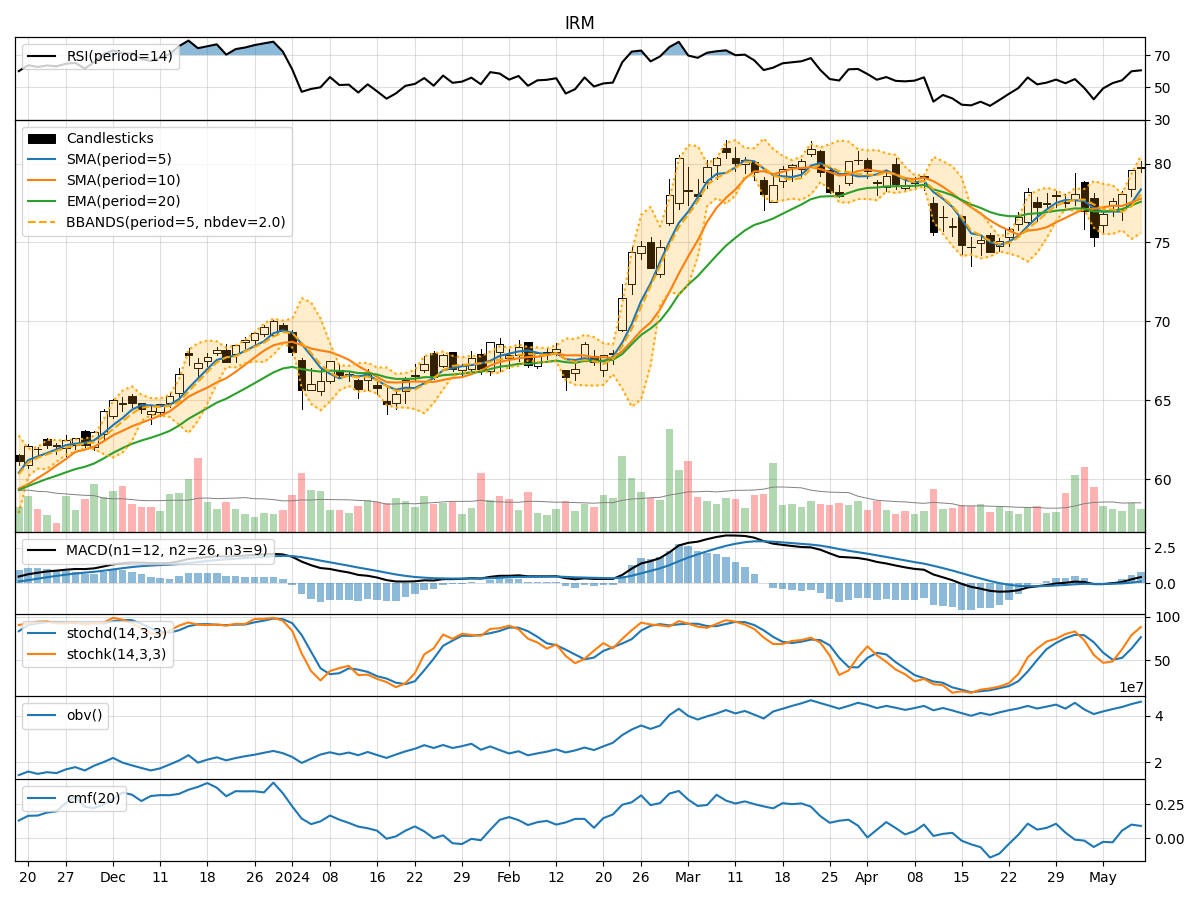
- Moving Averages (MA): The 5-day Moving Average (MA) has been showing an upward trend, indicating a positive momentum in the stock price.
- MACD: The Moving Average Convergence Divergence (MACD) has been consistently increasing, with the MACD line above the signal line, suggesting a bullish trend.
- EMA: The Exponential Moving Average (EMA) has been on an upward trajectory, further supporting the bullish sentiment.
Momentum Analysis:
- RSI: The Relative Strength Index (RSI) has been gradually increasing, reaching a level above 50, indicating strengthening momentum.
- Stochastic Oscillator: Both %K and %D lines of the Stochastic Oscillator have been rising, signaling an uptrend in momentum.
- Williams %R: The Williams %R is in the oversold region, suggesting a potential reversal in the stock price.
Volatility Analysis:
- Bollinger Bands: The Bollinger Bands have been widening, indicating increased volatility in the stock price.
- Bollinger %B: The %B indicator has been fluctuating within the bands, reflecting the volatility in the stock.
Volume Analysis:
- On-Balance Volume (OBV): The OBV has been steadily increasing, showing accumulation of the stock by investors.
- Chaikin Money Flow (CMF): The CMF has been positive, indicating buying pressure in the stock.
Key Observations:
- The trend indicators suggest a bullish sentiment with moving averages and MACD pointing towards an upward trend.
- Momentum indicators show a strengthening momentum with RSI and Stochastic Oscillator in favor of the bulls.
- Volatility has been increasing, which could lead to larger price swings in the coming days.
- Volume indicators indicate accumulation and buying pressure in the stock.
Conclusion:
Based on the analysis of the technical indicators, the next few days' possible stock price movement for IRM is likely to be* upward***. The bullish trend supported by moving averages, MACD, RSI, and Stochastic Oscillator signals a positive outlook for the stock. However, investors should closely monitor the increasing volatility and volume to navigate potential price fluctuations effectively.