Technical Analysis of IR 2024-05-10
Overview:
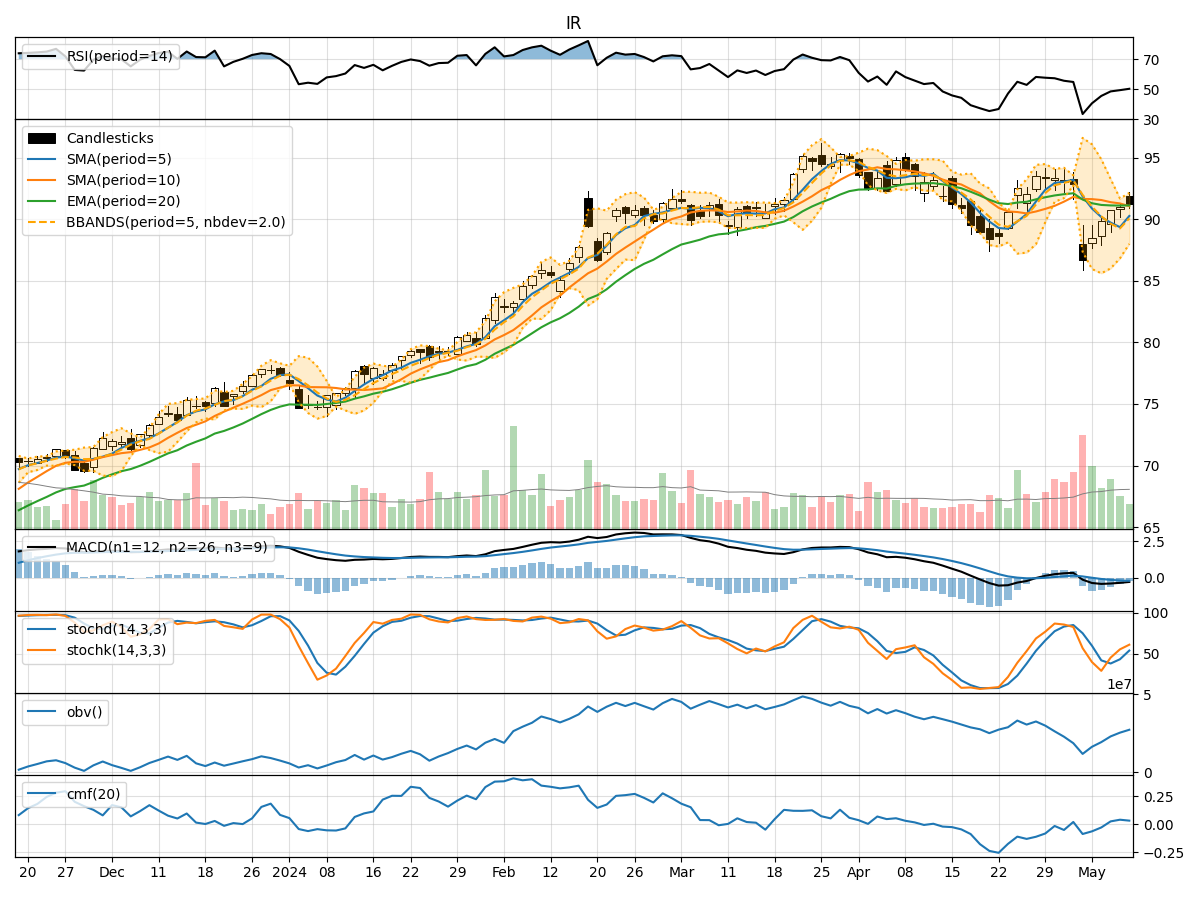
In analyzing the technical indicators for IR stock over the last 5 days, we will delve into the trend, momentum, volatility, and volume indicators to provide a comprehensive outlook on the possible stock price movement in the coming days.
Trend Analysis:
- Moving Averages (MA): The 5-day Moving Average (MA) has been consistently below the Simple Moving Average (SMA) and Exponential Moving Average (EMA) over the past 5 days, indicating a downward trend.
- MACD: The Moving Average Convergence Divergence (MACD) has been negative, with the MACD line consistently below the signal line, suggesting bearish momentum.
- MACD Histogram: The MACD Histogram has been decreasing, indicating a weakening bearish momentum.
Momentum Analysis:
- RSI: The Relative Strength Index (RSI) has been gradually increasing but remains below the overbought threshold of 70, indicating a potential for further upside momentum.
- Stochastic Oscillator: Both %K and %D lines of the Stochastic Oscillator have been rising, suggesting increasing buying pressure.
- Williams %R: The Williams %R indicator has been improving but remains in the oversold territory, indicating a potential reversal.
Volatility Analysis:
- Bollinger Bands (BB): The stock price has been trading within the lower Bollinger Band, indicating a potential oversold condition.
- Bollinger Band Width: The Bollinger Band Width has been narrowing, suggesting a decrease in volatility.
- Bollinger Band %B: The %B indicator has been increasing but remains below 1, indicating a potential bounce back.
Volume Analysis:
- On-Balance Volume (OBV): The OBV has been declining, indicating a net selling pressure in the stock.
- Chaikin Money Flow (CMF): The CMF has been slightly positive, suggesting some buying interest in the stock.
Conclusion:
Based on the analysis of the technical indicators: - Trend: The stock is currently in a downtrend based on moving averages and MACD. - Momentum: There are signs of potential upside momentum as indicated by RSI and Stochastic Oscillator. - Volatility: The narrowing Bollinger Bands and potential bounce back indicated by %B suggest a possible reversal in the stock price. - Volume: The declining OBV indicates selling pressure, but the slightly positive CMF hints at some buying interest.
Overall Opinion:
Considering the mixed signals from the technical indicators, it is likely that the stock price of IR may experience near-term consolidation or a moderate rebound. Traders should closely monitor key levels and wait for confirmation of a new trend direction before making significant trading decisions.