Technical Analysis of IP 2024-05-10
Overview:
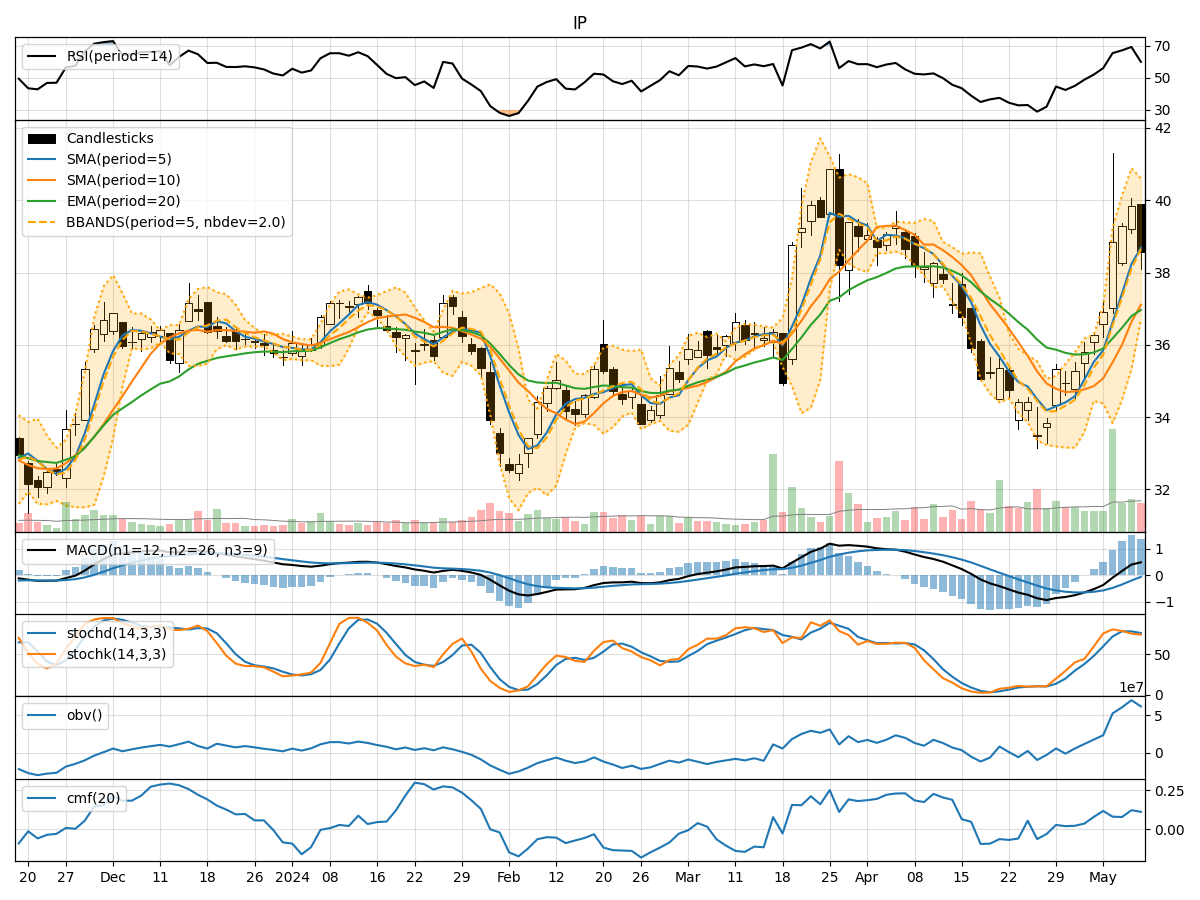
In the last 5 trading days, the stock price of IP has shown a mixed trend with fluctuations in price and volume. By analyzing various technical indicators such as trend, momentum, volatility, and volume, we can gain insights into the possible future movements of the stock price.
Trend Analysis:
- Moving Averages (MA): The 5-day Moving Average (MA) has been increasing, indicating a short-term uptrend in the stock price.
- MACD: The MACD line has been positive, suggesting bullish momentum in the stock.
- RSI: The Relative Strength Index (RSI) has been fluctuating but generally staying in the neutral to slightly overbought territory.
Key Observation: The trend indicators suggest a bullish sentiment in the stock price over the last few days.
Momentum Analysis:
- Stochastic Oscillator: The Stochastic Oscillator has been fluctuating but has not reached extreme levels, indicating potential room for further price movement.
- Williams %R: The Williams %R has been fluctuating in the oversold territory, suggesting a potential reversal in the stock price.
Key Observation: Momentum indicators show mixed signals, with a slight bias towards a potential upward movement.
Volatility Analysis:
- Bollinger Bands (BB): The Bollinger Bands have been widening, indicating increased volatility in the stock price.
- BB% (BB Percentage): The BB% has been fluctuating, suggesting potential price swings in the near future.
Key Observation: Volatility indicators point towards increased price fluctuations in the upcoming days.
Volume Analysis:
- On-Balance Volume (OBV): The OBV has been fluctuating but has shown overall positive accumulation, indicating buying interest in the stock.
- Chaikin Money Flow (CMF): The CMF has been positive, suggesting money flow into the stock.
Key Observation: Volume indicators reflect positive buying interest and accumulation in the stock.
Conclusion:
Based on the analysis of the technical indicators, the stock of IP is likely to experience further upward movement in the next few days. The trend indicators show a bullish sentiment, supported by positive momentum and volume indicators. Although there might be increased volatility, the overall outlook remains bullish. Traders and investors could consider buying opportunities in IP stock for potential short to medium-term gains.
Disclaimer:
Remember that technical analysis is not a guaranteed predictor of future price movements, and other fundamental factors can influence stock prices. It is essential to conduct thorough research and consider multiple indicators before making any investment decisions. Consulting with a financial advisor is recommended for personalized investment advice.