Technical Analysis of INFY 2024-05-10
Overview:
In analyzing the technical indicators for Infosys (INFY) over the last 5 days, we will delve into the trend, momentum, volatility, and volume indicators to provide a comprehensive outlook on the possible stock price movement. By examining these key indicators, we aim to offer valuable insights and predictions for the upcoming days.
Trend Indicators:
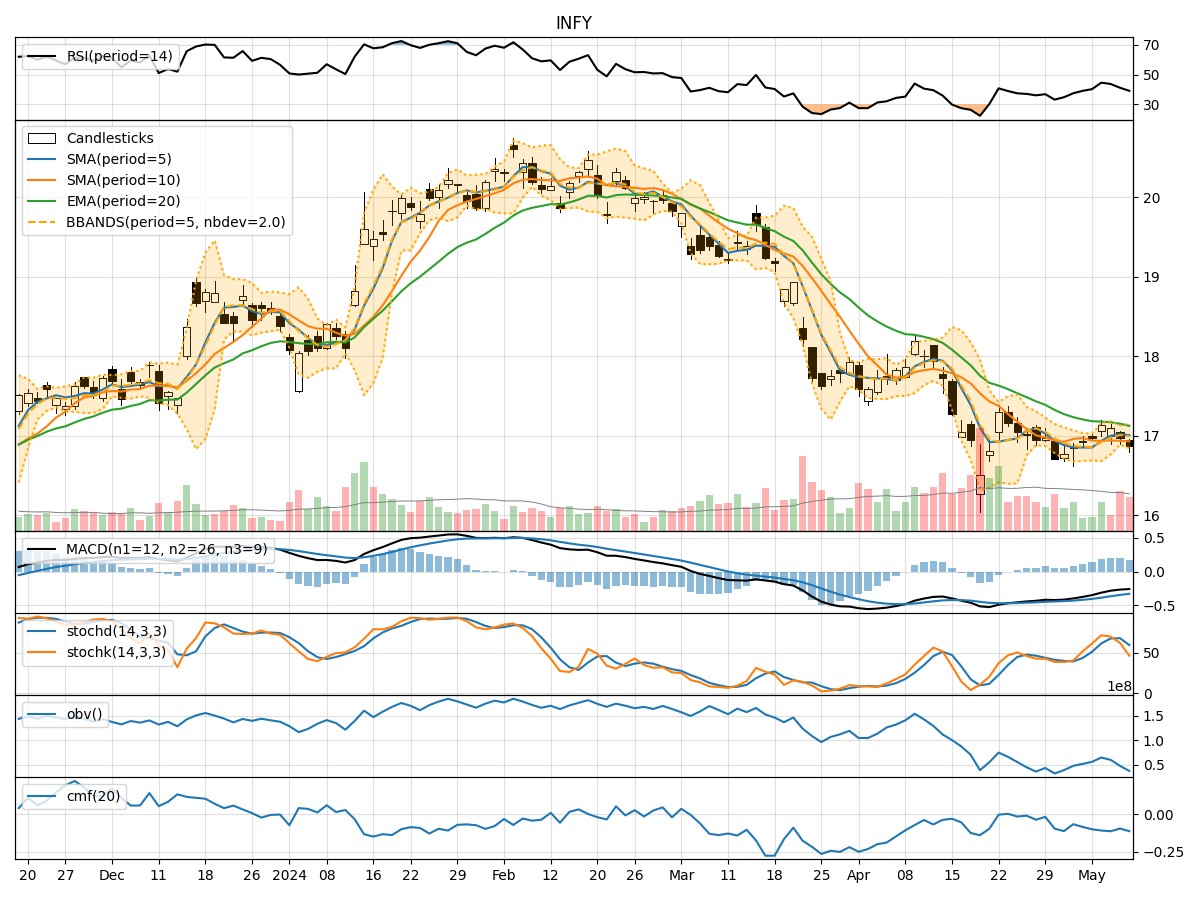
- Moving Averages (MA): The 5-day MA has been fluctuating around the closing prices, indicating a lack of clear trend direction.
- MACD: The MACD line has been consistently below the signal line, suggesting a bearish momentum in the short term.
- RSI: The RSI values have been hovering around the neutral zone, indicating a balanced momentum without any extreme overbought or oversold conditions.
Momentum Indicators:
- Stochastic Oscillator: The stochastic indicators have been showing a downward trend, with the %K and %D lines moving towards oversold territory.
- Williams %R: The Williams %R values have been consistently in oversold territory, indicating a potential reversal or consolidation phase.
Volatility Indicators:
- Bollinger Bands: The Bollinger Bands have been narrowing, suggesting a decrease in volatility and a possible period of consolidation.
- Average True Range (ATR): The ATR values have been relatively stable, indicating a lack of significant price movements.
Volume Indicators:
- On-Balance Volume (OBV): The OBV values have been consistently negative, indicating selling pressure and a bearish sentiment in the market.
- Chaikin Money Flow (CMF): The CMF values have been negative, reflecting a lack of buying interest and potential outflow of money from the stock.
Key Observations:
- The trend indicators show a lack of clear direction, with the MACD signaling a bearish momentum.
- Momentum indicators suggest a potential oversold condition, indicating a possible reversal or consolidation phase.
- Volatility indicators point towards a period of reduced volatility and consolidation.
- Volume indicators highlight selling pressure and a bearish sentiment in the market.
Conclusion:
Based on the analysis of the technical indicators, the next few days for Infosys (INFY) are likely to see further downward movement in the stock price. The bearish momentum indicated by the MACD, coupled with oversold conditions in the stochastic and Williams %R indicators, suggests a potential continuation of the current downtrend. Additionally, the negative OBV and CMF values indicate a lack of buying interest and selling pressure in the market. Traders and investors should exercise caution and consider short-term bearish strategies until a clear reversal pattern emerges in the technical indicators.