Technical Analysis of IHS 2024-05-10
Overview:
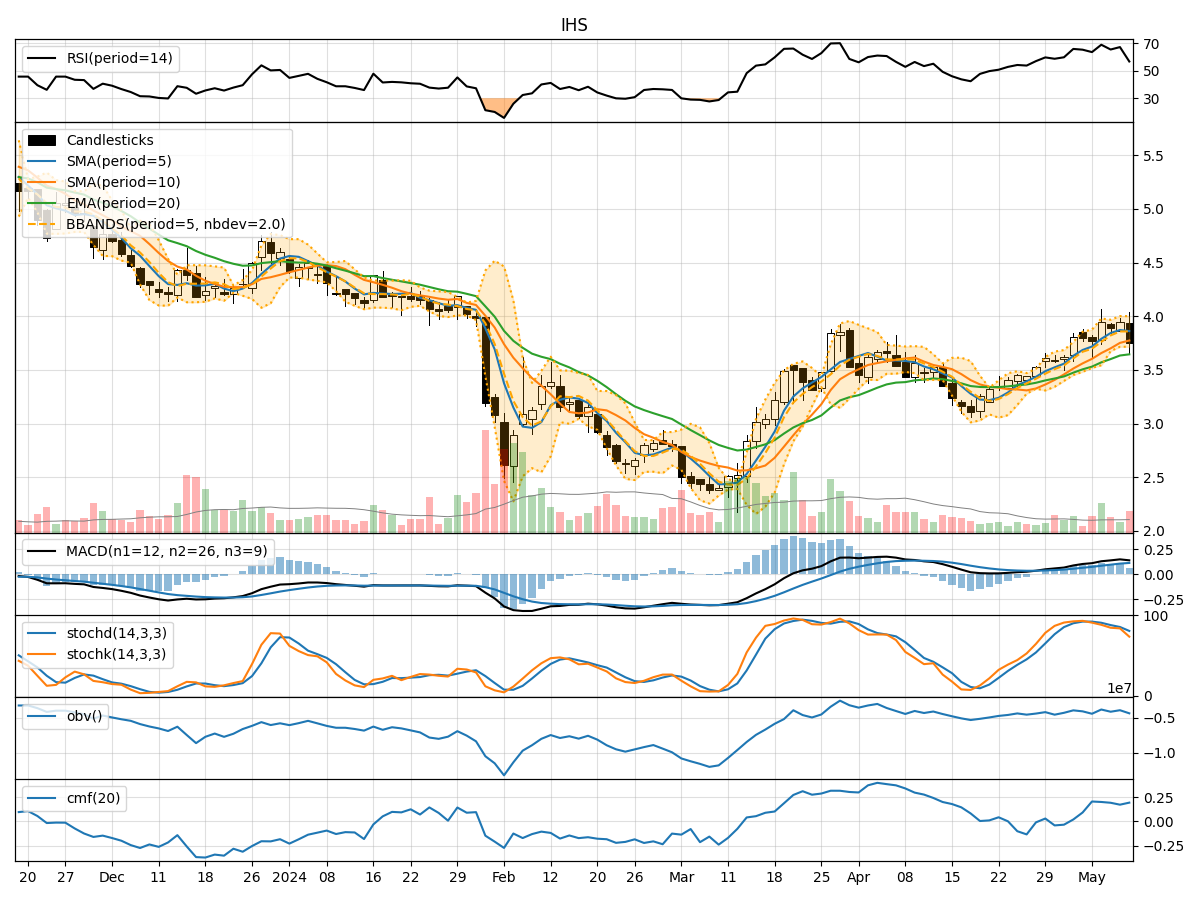
In analyzing the provided IHS Technical Analysis (TA) data for the last 5 days, we will delve into the trend, momentum, volatility, and volume indicators to derive insights into the possible future stock price movement. By examining these key indicators, we aim to provide a comprehensive analysis and make informed predictions for the upcoming days.
Trend Indicators:
- Moving Averages (MA): The moving averages show a consistent uptrend over the last 5 days, with the closing price consistently above the short-term moving averages.
- MACD: The MACD line has been positive, indicating a bullish momentum in the stock price.
- MACD Histogram: The MACD histogram has been increasing, suggesting strengthening bullish momentum.
Momentum Indicators:
- RSI: The Relative Strength Index (RSI) has been fluctuating but generally staying within the neutral range, indicating a balanced momentum.
- Stochastic Oscillator: The Stochastic Oscillator shows a slight decline but remains in the overbought territory, suggesting a potential reversal.
- Williams %R: The Williams %R indicator has been in the oversold region, indicating a possible buying opportunity.
Volatility Indicators:
- Bollinger Bands: The Bollinger Bands have been narrowing, indicating decreasing volatility and a potential upcoming price breakout.
- Bollinger %B: The %B indicator is currently below 1, suggesting the stock price is trading below the lower Bollinger Band.
Volume Indicators:
- On-Balance Volume (OBV): The OBV has been fluctuating but shows a slight increase, indicating some accumulation of the stock.
- Chaikin Money Flow (CMF): The CMF has been positive, indicating buying pressure in the stock.
Key Observations and Opinions:
- Trend: The stock is in an upward trend based on the moving averages and MACD analysis.
- Momentum: The momentum indicators suggest a neutral to slightly bearish bias due to the RSI and Stochastic Oscillator readings.
- Volatility: The narrowing Bollinger Bands indicate a potential price breakout in the near future.
- Volume: The volume indicators show mixed signals with slight accumulation based on OBV and CMF.
Conclusion:
Based on the analysis of the technical indicators, the stock is likely to experience increased volatility in the upcoming days, potentially leading to a bullish breakout given the positive trend signals from the moving averages and MACD. However, caution is advised due to the neutral to slightly bearish momentum signals from the RSI and Stochastic Oscillator. Traders should closely monitor the price action and volume dynamics for confirmation of the anticipated breakout.