Technical Analysis of IHG 2024-05-10
Overview:
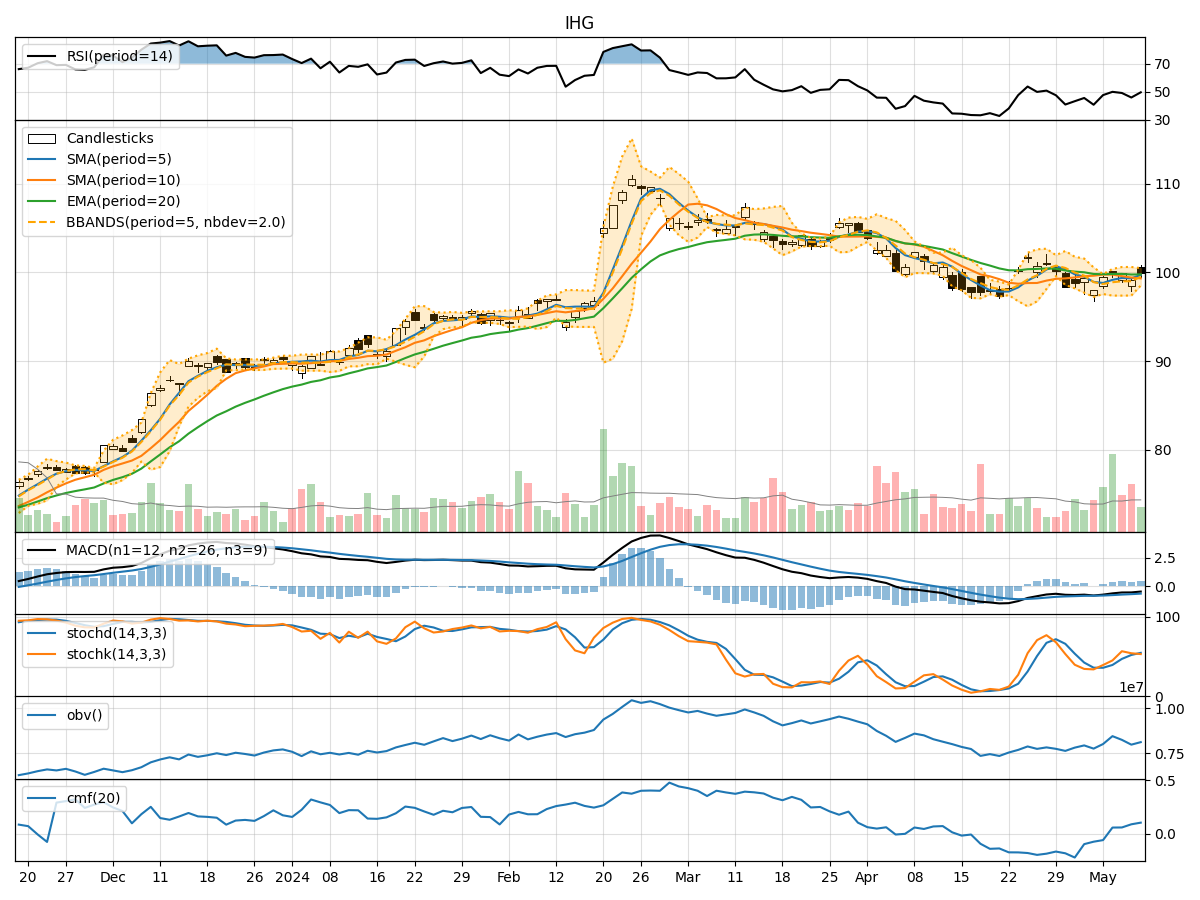
In analyzing the technical indicators for IHG over the last 5 days, we will delve into the trend, momentum, volatility, and volume indicators to provide a comprehensive assessment of the stock's potential price movement. By examining these key factors, we aim to offer valuable insights and predictions for the next few days.
Trend Indicators:
- Moving Averages (MA): The 5-day MA has been consistently above the closing prices, indicating a short-term uptrend.
- MACD: The MACD line has been negative but showing signs of convergence with the signal line, suggesting a potential reversal.
- RSI: The RSI has been fluctuating around the neutral zone, indicating indecision in the market sentiment.
Momentum Indicators:
- Stochastic Oscillator: The stochastic indicators have been mixed, with no clear overbought or oversold signals.
- Williams %R: The Williams %R is hovering around the oversold territory, indicating a possible buying opportunity.
Volatility Indicators:
- Bollinger Bands (BB): The stock price has been trading within the Bollinger Bands, suggesting a period of consolidation.
- Average True Range (ATR): The ATR has been relatively stable, indicating consistent price movements.
Volume Indicators:
- On-Balance Volume (OBV): The OBV has shown mixed signals, reflecting uncertainty in the accumulation/distribution of the stock.
- Chaikin Money Flow (CMF): The CMF has been positive, indicating potential buying pressure in the market.
Key Observations:
- The trend indicators suggest a potential reversal in the short-term uptrend.
- Momentum indicators show mixed signals, with a slight bias towards a buying opportunity.
- Volatility indicators point towards a period of consolidation.
- Volume indicators reflect uncertainty in market participation and accumulation.
Conclusion:
Based on the analysis of the technical indicators, the next few days for IHG stock price movement could be sideways with a slight bullish bias. Traders may expect the stock to consolidate within a range, with potential buying opportunities emerging as the indicators show signs of stabilization. It is advisable to closely monitor the MACD for confirmation of a trend reversal and the Williams %R for potential entry points. Overall, a cautious approach with a focus on risk management is recommended in the current market environment.