Technical Analysis of IEX 2024-05-10
Overview:
In the last 5 trading days, the stock price of IEX has shown some fluctuations, with a slight increase towards the end of the period. Various technical indicators have been analyzed to provide insights into the possible future stock price movement. The analysis includes trend indicators, momentum indicators, volatility indicators, and volume indicators.
Trend Indicators:
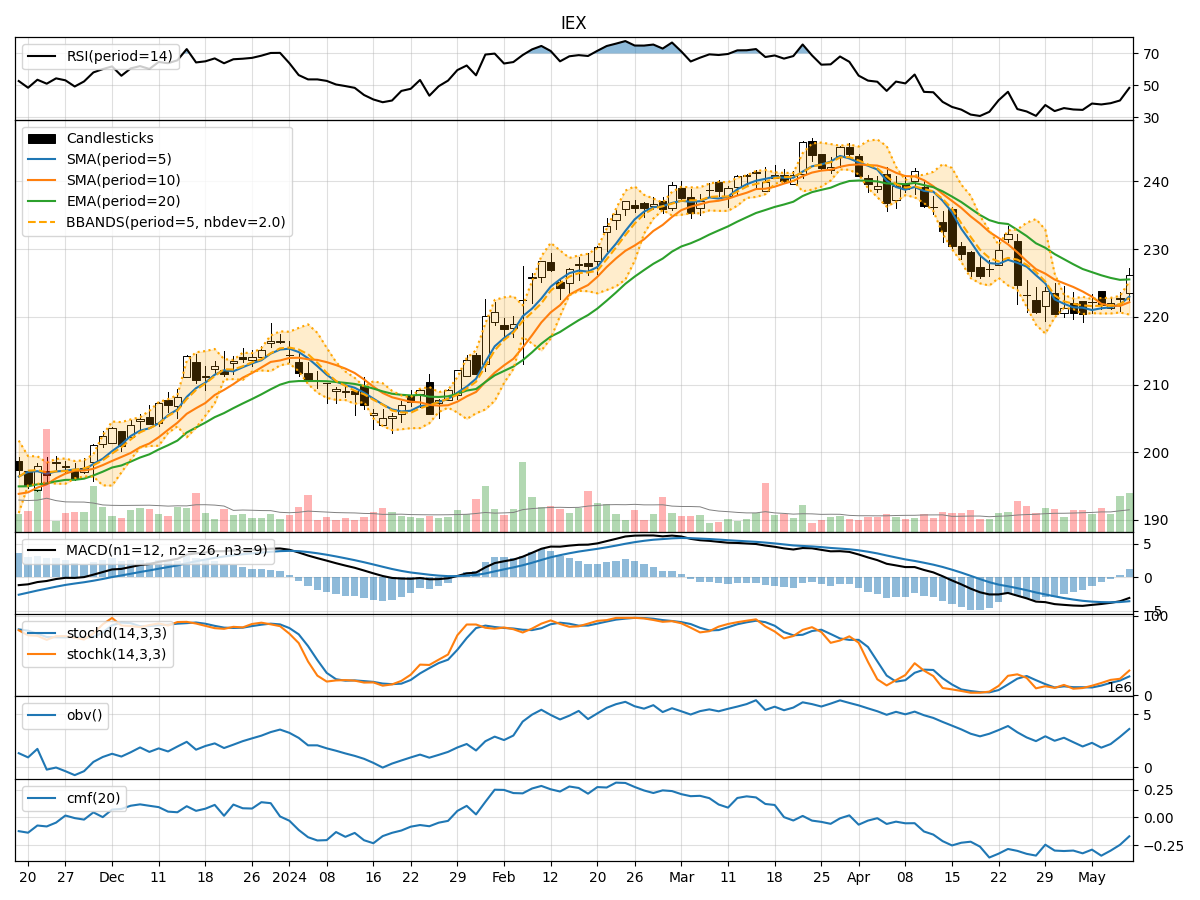
- Moving Averages (MA): The 5-day MA has been fluctuating around the closing prices, indicating short-term price trends. The SMA(10) and EMA(20) show a slight downward trend, suggesting a potential bearish sentiment.
- MACD: The MACD line has been negative, indicating a bearish trend. The MACD Histogram has shown a slight improvement but remains in negative territory.
Momentum Indicators:
- RSI: The RSI has been gradually increasing, indicating a strengthening momentum. However, it is still below the overbought threshold, suggesting room for further upside.
- Stochastic Oscillator: Both %K and %D have been rising, indicating increasing buying pressure. The stock is not yet in the overbought zone, suggesting potential for further gains.
Volatility Indicators:
- Bollinger Bands (BB): The stock price has been trading within the bands, with the upper band expanding on the last trading day. This could indicate increased volatility and potential price movement.
- Bollinger %B (BBP): The %B has been fluctuating but remains below 1, suggesting the stock is not overbought.
Volume Indicators:
- On-Balance Volume (OBV): The OBV has shown a mixed trend, with some days seeing selling pressure. This could indicate uncertainty among investors.
- Chaikin Money Flow (CMF): The CMF has been negative, indicating a lack of buying pressure. This could potentially limit upward price movement.
Key Observations and Opinions:
- Trend: The trend indicators suggest a slightly bearish sentiment in the short term.
- Momentum: Momentum indicators show a potential for further upside, supported by increasing RSI and Stochastic values.
- Volatility: The expanding Bollinger Bands and moderate %B values indicate potential price movement.
- Volume: Mixed signals from volume indicators suggest uncertainty among investors.
Conclusion:
Based on the analysis of the technical indicators, the next few days could see upward price movement in the stock of IEX. The momentum indicators suggest a potential for further gains, while volatility indicators indicate the possibility of price movement. However, the trend indicators show a slightly bearish sentiment, so caution is advised. Investors should closely monitor the price action and key levels to make informed trading decisions.