Technical Analysis of ICL 2024-05-10
Overview:
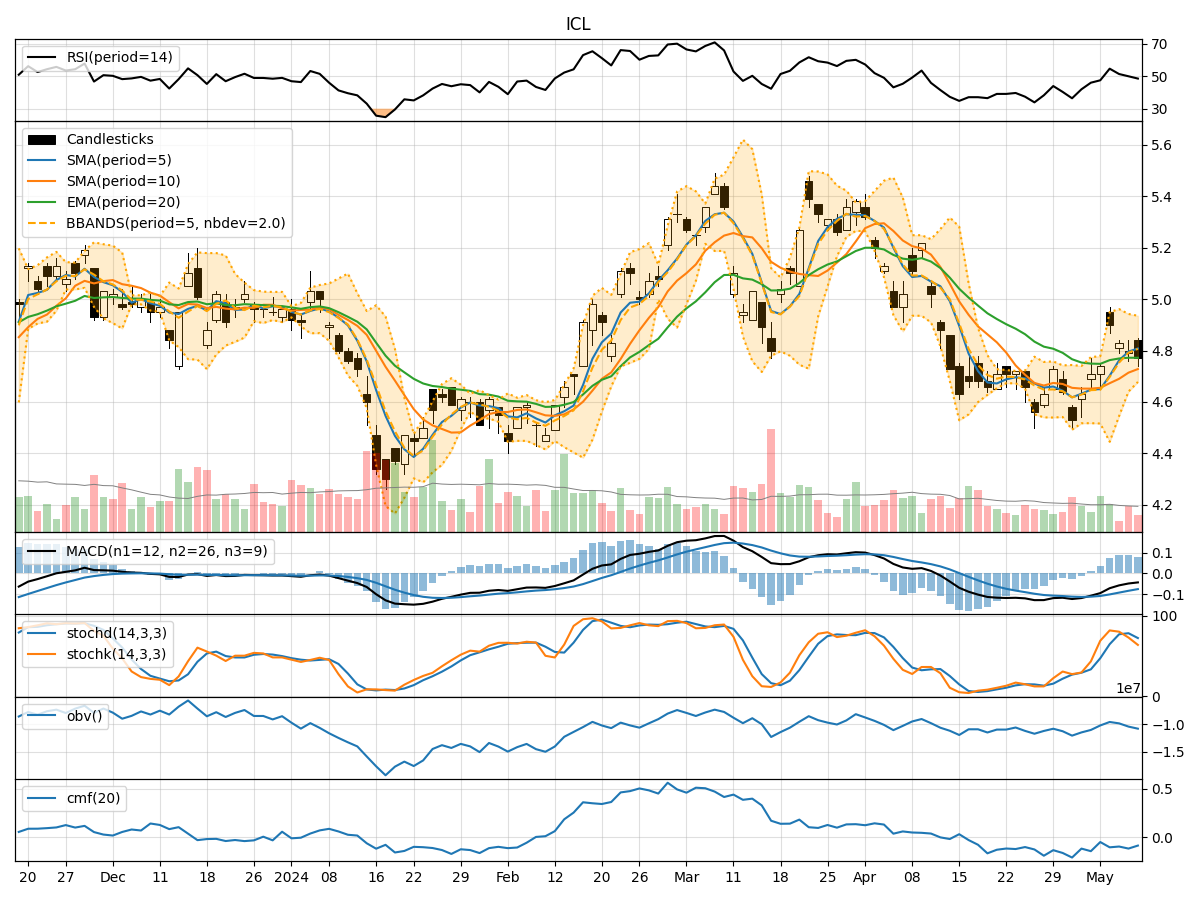
In analyzing the technical indicators for ICL over the last 5 days, we will delve into the trend, momentum, volatility, and volume indicators to provide a comprehensive outlook on the possible stock price movement in the coming days.
Trend Analysis:
- Moving Averages (MA): The 5-day MA has been consistently above the closing prices, indicating a short-term uptrend.
- MACD: The MACD line has been below the signal line but showing signs of convergence, suggesting a potential reversal in the downtrend.
- EMA: The EMA has been relatively flat, reflecting a lack of strong trend direction.
Momentum Analysis:
- RSI: The RSI has been hovering around the mid-level, indicating a neutral momentum.
- Stochastic Oscillator: Both %K and %D have been declining, signaling a potential bearish momentum.
- Williams %R: The indicator has been in oversold territory, suggesting a possible reversal to the upside.
Volatility Analysis:
- Bollinger Bands (BB): The bands have been narrowing, indicating decreasing volatility.
- BB %B: The %B has been relatively low, suggesting a potential consolidation phase.
- BB Width: The width of the bands has been decreasing, indicating a reduction in price volatility.
Volume Analysis:
- On-Balance Volume (OBV): The OBV has been declining, indicating selling pressure.
- Chaikin Money Flow (CMF): The CMF has been negative, reflecting a lack of buying interest.
Key Observations:
- The trend indicators suggest a potential reversal in the short-term downtrend.
- Momentum indicators show mixed signals, with RSI neutral but stochastic oscillator indicating bearish momentum.
- Volatility indicators point towards a consolidation phase with decreasing volatility.
- Volume indicators reflect selling pressure and a lack of significant buying interest.
Conclusion:
Based on the analysis of the technical indicators, the stock price of ICL is likely to experience sideways movement in the coming days. The trend indicators hint at a potential reversal, but the mixed signals from momentum indicators and lack of significant buying interest reflected in volume indicators suggest a period of consolidation. Traders should exercise caution and wait for clearer signals before making significant trading decisions.