Technical Analysis of ICE 2024-05-10
Overview:
In analyzing the technical indicators for ICE stock over the last 5 days, we will delve into the trend, momentum, volatility, and volume indicators to provide a comprehensive outlook on the possible stock price movement in the coming days. By examining these key indicators, we aim to offer valuable insights and predictions for potential investors.
Trend Analysis:
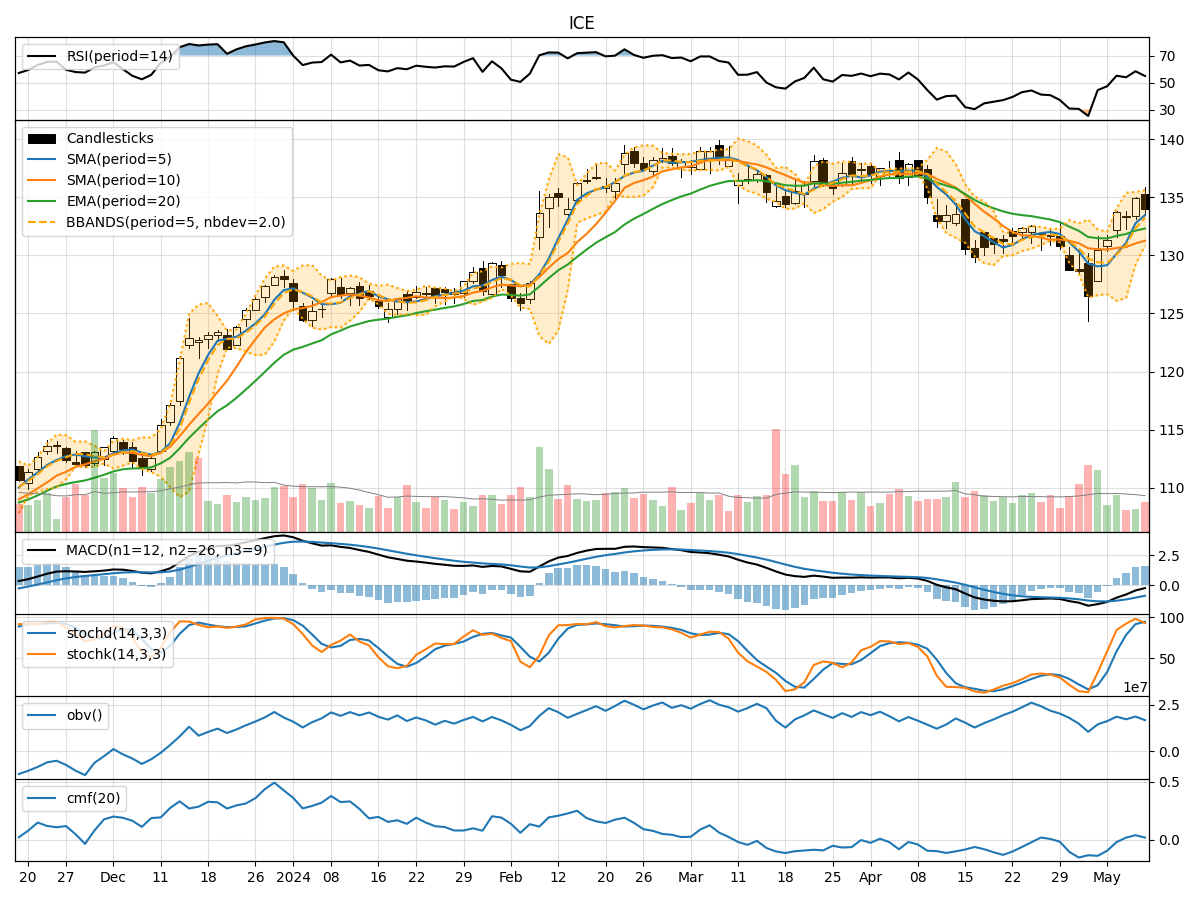
- Moving Averages (MA): The 5-day moving average has been consistently rising, indicating a bullish trend in the short term.
- MACD: The MACD line has been trending upwards, suggesting a strengthening bullish momentum.
- EMA: The exponential moving average has also been on an upward trajectory, supporting the bullish trend.
Momentum Analysis:
- RSI: The Relative Strength Index has been fluctuating but is currently in the neutral zone, indicating a balanced momentum.
- Stochastic Oscillator: Both %K and %D have been in the overbought territory, signaling a potential reversal or consolidation.
- Williams %R: The Williams %R is in the oversold region, suggesting a possible buying opportunity.
Volatility Analysis:
- Bollinger Bands: The stock price has been trading within the bands, indicating a period of consolidation.
- Bollinger %B: The %B indicator is below 1, suggesting the stock is trading below the upper band and may see a potential reversal.
Volume Analysis:
- On-Balance Volume (OBV): The OBV has been fluctuating, indicating mixed buying and selling pressure.
- Chaikin Money Flow (CMF): The CMF is slightly positive, suggesting some accumulation in the stock.
Key Observations:
- The trend indicators point towards a bullish sentiment in the short term.
- Momentum indicators show a mixed signal with potential for a reversal or consolidation.
- Volatility indicators suggest a period of consolidation with a potential breakout.
- Volume indicators indicate mixed buying and selling pressure with some accumulation.
Conclusion:
Based on the analysis of the technical indicators, the stock is likely to experience sideways consolidation in the coming days with a potential for a bullish breakout. Investors should closely monitor the momentum indicators for any signs of a reversal and consider the volatility for potential trading opportunities. Overall, the stock shows potential for an upward movement in the near future.