Technical Analysis of HWM 2024-05-10
Overview:
In analyzing the technical indicators for HWM stock over the last 5 days, we will delve into the trend, momentum, volatility, and volume indicators to provide a comprehensive outlook on the possible stock price movement in the coming days. By examining these key aspects, we aim to offer valuable insights and predictions to guide your investment decisions.
Trend Analysis:
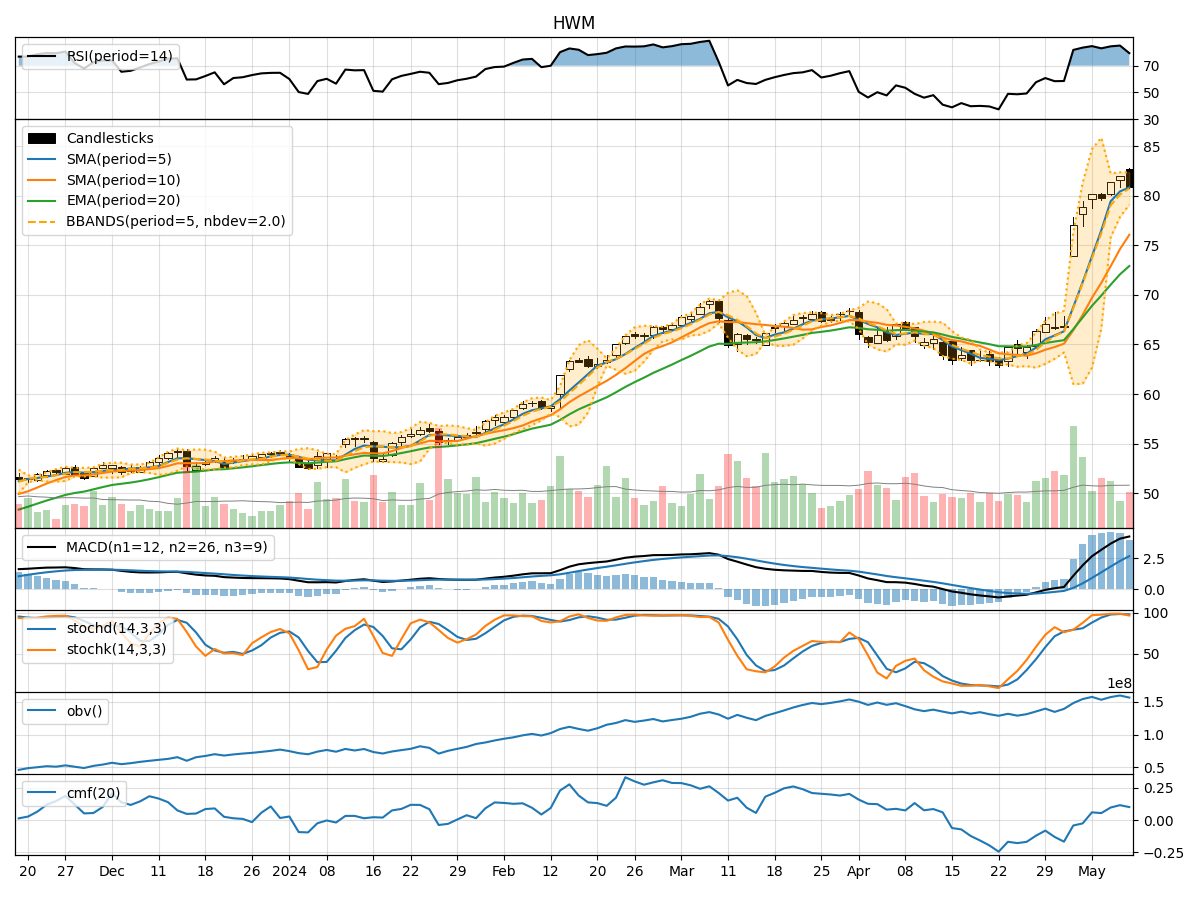
- Moving Averages (MA): The 5-day moving average has been consistently rising, indicating a bullish trend in the short term.
- MACD: The MACD line has been increasing, crossing above the signal line, suggesting a strengthening bullish momentum.
- RSI: The RSI is in the overbought territory, signaling a potential pullback or consolidation in the near future.
Momentum Analysis:
- Stochastic Oscillator: Both %K and %D are in the overbought zone, implying a possible reversal or correction.
- Williams %R: The indicator is in the oversold region, indicating a potential buying opportunity.
Volatility Analysis:
- Bollinger Bands: The bands have been narrowing, suggesting a period of consolidation or reduced volatility.
- Bollinger %B: The %B indicator is relatively low, indicating a potential buying opportunity as the stock may be oversold.
Volume Analysis:
- On-Balance Volume (OBV): The OBV has been increasing, reflecting accumulation by investors.
- Chaikin Money Flow (CMF): The CMF is positive, indicating buying pressure in the stock.
Key Observations:
- The stock is currently in a bullish trend based on moving averages and MACD.
- Momentum indicators suggest a potential reversal or correction due to overbought conditions.
- Volatility indicators point towards a period of consolidation or reduced price movement.
- Volume indicators show positive accumulation and buying pressure in the stock.
Conclusion:
Based on the analysis of technical indicators, the stock is likely to experience a short-term correction or consolidation in the coming days due to overbought momentum signals. However, the overall trend remains bullish supported by moving averages and MACD. Investors should consider potential buying opportunities during pullbacks or dips in price. It is advisable to closely monitor key support and resistance levels for better entry and exit points in alignment with the broader market trend.