Technical Analysis of HSY 2024-05-10
Overview:
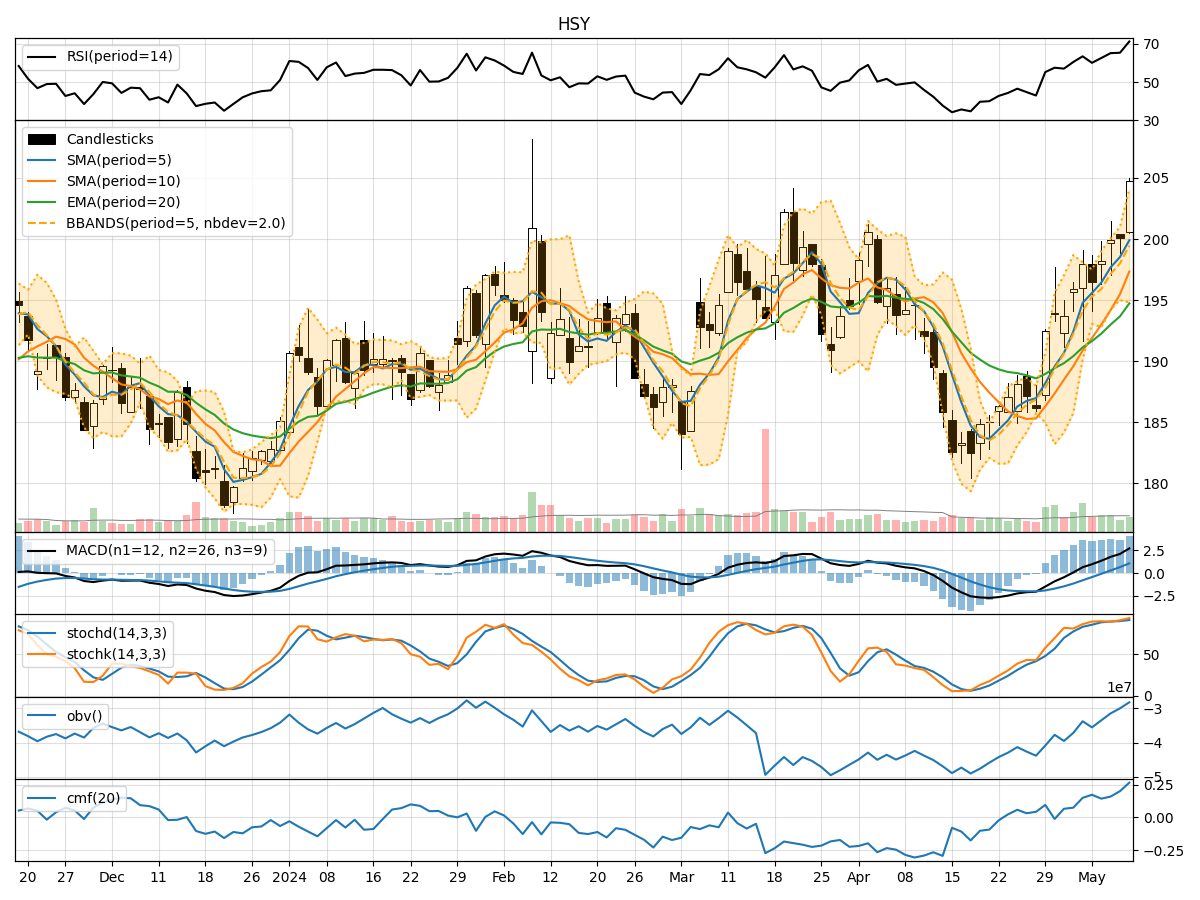
In analyzing the technical indicators for HSY (The Hershey Company) over the last 5 days, we will delve into the trends, momentum, volatility, and volume indicators to provide insights into the possible future stock price movements. By examining these key indicators, we aim to offer a comprehensive analysis and make informed predictions for the upcoming days.
Trend Analysis:
- Moving Averages (MA): The 5-day Moving Average (MA) has been consistently rising, indicating a bullish trend in the short term.
- MACD (Moving Average Convergence Divergence): The MACD and Signal Line have been trending upwards, suggesting increasing bullish momentum.
- EMA (Exponential Moving Average): The EMA has been steadily climbing, supporting the bullish trend.
Momentum Analysis:
- RSI (Relative Strength Index): The RSI has been increasing and is currently in the overbought territory, signaling a strong bullish momentum.
- Stochastic Oscillator: Both %K and %D lines of the Stochastic Oscillator are in the overbought zone, indicating a potential reversal or consolidation.
- Williams %R (Willams Percentage Range): The Williams %R is also in the overbought region, suggesting a possible pullback.
Volatility Analysis:
- Bollinger Bands: The Bollinger Bands have widened, indicating increased volatility in the stock price.
- Bollinger %B: The %B is close to 1, suggesting that the stock price is near the upper band, potentially indicating an overbought condition.
Volume Analysis:
- On-Balance Volume (OBV): The OBV has been steadily increasing, reflecting strong buying pressure in the stock.
- Chaikin Money Flow (CMF): The CMF is positive, indicating that money is flowing into the stock.
Key Observations:
- The stock is currently in a strong bullish trend based on moving averages and MACD.
- Momentum indicators suggest that the stock may be overbought and could experience a pullback or consolidation.
- Volatility has increased, which could lead to larger price swings in the near future.
- The volume indicators show strong buying pressure, supporting the bullish outlook.
Conclusion:
Based on the analysis of the technical indicators, the stock price of HSY is likely to experience a short-term pullback or consolidation due to the overbought conditions indicated by momentum indicators like RSI, Stochastic Oscillator, and Williams %R. However, the overall trend remains bullish, supported by moving averages and volume indicators. Traders may consider taking profits or waiting for a better entry point during the potential pullback.