Technical Analysis of HPQ 2024-05-10
Overview:
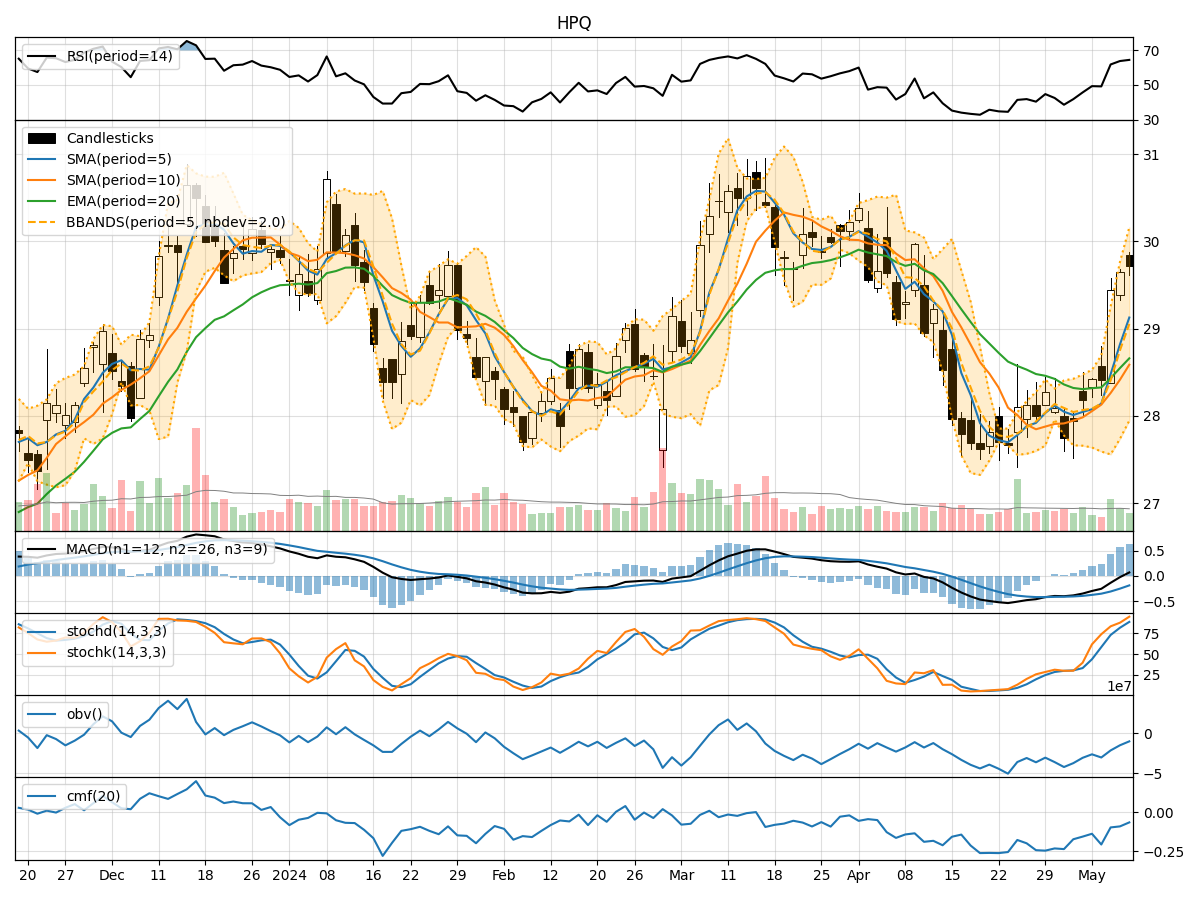
In analyzing the technical indicators for HPQ over the last 5 days, we will delve into the trend, momentum, volatility, and volume indicators to provide a comprehensive outlook on the possible stock price movement in the coming days.
Trend Analysis:
- Moving Averages (MA): The 5-day Moving Average has been consistently rising, indicating a bullish trend in the short term.
- MACD: The MACD line has been trending upwards, with the MACD histogram showing an increasing positive momentum.
- EMA: The Exponential Moving Average has been on an upward trajectory, supporting the bullish trend.
Momentum Analysis:
- RSI: The Relative Strength Index has been hovering around the overbought territory, suggesting a strong bullish momentum.
- Stochastic Oscillator: Both %K and %D have been in the overbought zone, indicating a strong buying pressure.
- Williams %R: The indicator has been in the oversold region, signaling a potential reversal to the upside.
Volatility Analysis:
- Bollinger Bands: The stock price has been trading close to the upper Bollinger Band, indicating high volatility and a potential continuation of the uptrend.
- Bollinger %B: The %B indicator is above 0.8, suggesting that the stock is trading near the upper band and may be overbought.
Volume Analysis:
- On-Balance Volume (OBV): The OBV has been steadily increasing, reflecting strong buying volume in the stock.
- Chaikin Money Flow (CMF): The CMF has been negative, indicating some distribution in the stock, but the recent uptrend in OBV suggests buying pressure may outweigh selling.
Key Observations:
- The technical indicators collectively point towards a strong bullish sentiment in the stock.
- The momentum indicators suggest that the stock is currently overbought, but the trend remains intact.
- Volatility is high, indicating potential price swings, while volume supports the bullish bias.
Conclusion:
Based on the analysis of the technical indicators, the next few days are likely to see continued upward movement in HPQ stock price. Traders and investors may consider buying on dips to capitalize on the ongoing bullish trend. However, caution is advised as the stock is currently overbought, and a pullback or consolidation phase may occur in the near future.