Technical Analysis of HPE 2024-05-10
Overview:
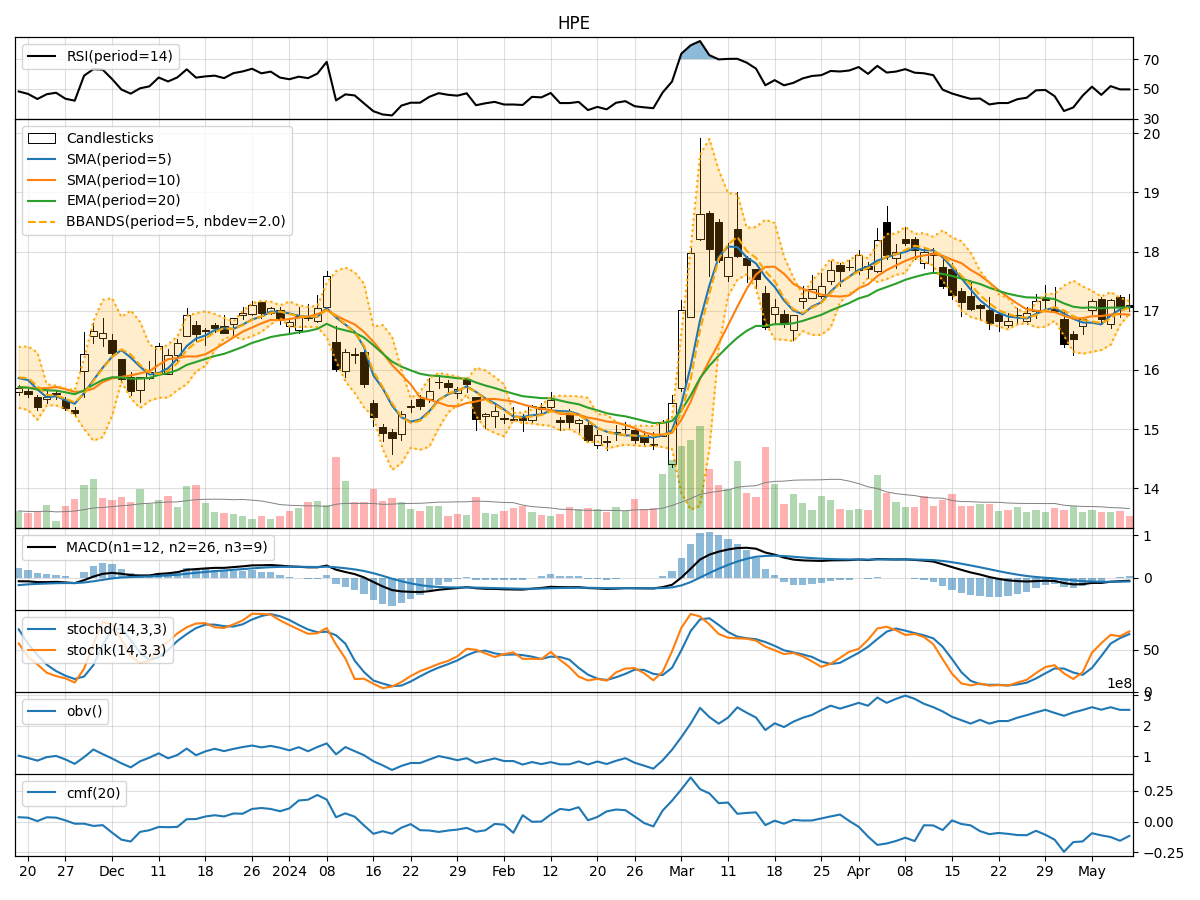
In analyzing the technical indicators for HPE over the last 5 days, we will delve into the trend, momentum, volatility, and volume indicators to provide a comprehensive outlook on the possible stock price movement in the coming days. By examining these key aspects, we aim to offer valuable insights and recommendations for potential investors.
Trend Analysis:
- Moving Averages (MA): The 5-day Moving Average (MA) has been fluctuating around the current stock price, indicating a lack of clear trend direction.
- MACD: The Moving Average Convergence Divergence (MACD) has been hovering around the zero line, suggesting a neutral stance in terms of momentum.
Key Observation: The trend indicators show a lack of strong directional bias in the stock price movement.
Momentum Analysis:
- RSI: The Relative Strength Index (RSI) has been oscillating around the 50 level, reflecting a balanced momentum between buying and selling pressure.
- Stochastic Oscillator: The Stochastic Oscillator has been in the overbought territory, indicating a potential reversal in the short term.
Key Observation: Momentum indicators suggest a neutral to slightly bearish sentiment in the stock's momentum.
Volatility Analysis:
- Bollinger Bands (BB): The Bollinger Bands have been narrowing, indicating decreasing volatility in the stock price.
Key Observation: Volatility indicators point towards a potential decrease in price fluctuations.
Volume Analysis:
- On-Balance Volume (OBV): The OBV has been relatively stable, showing no significant divergence between price and volume movements.
- Chaikin Money Flow (CMF): The CMF has been negative, indicating a lack of buying pressure in the stock.
Key Observation: Volume indicators suggest a neutral to slightly bearish outlook in terms of volume-driven price movements.
Conclusion:
Based on the analysis of the technical indicators, the next few days' possible stock price movement for HPE is likely to be sideways with a slight bearish bias. The lack of strong trends in the trend indicators, coupled with neutral to bearish signals in momentum, volatility, and volume indicators, indicates a period of consolidation or minor downward pressure in the stock price.
Investors should exercise caution and consider waiting for clearer signals before making significant trading decisions. Monitoring key support and resistance levels, as well as potential trend reversals in the technical indicators, will be crucial in navigating the upcoming price movements in HPE.