Technical Analysis of HMY 2024-05-10
Overview:
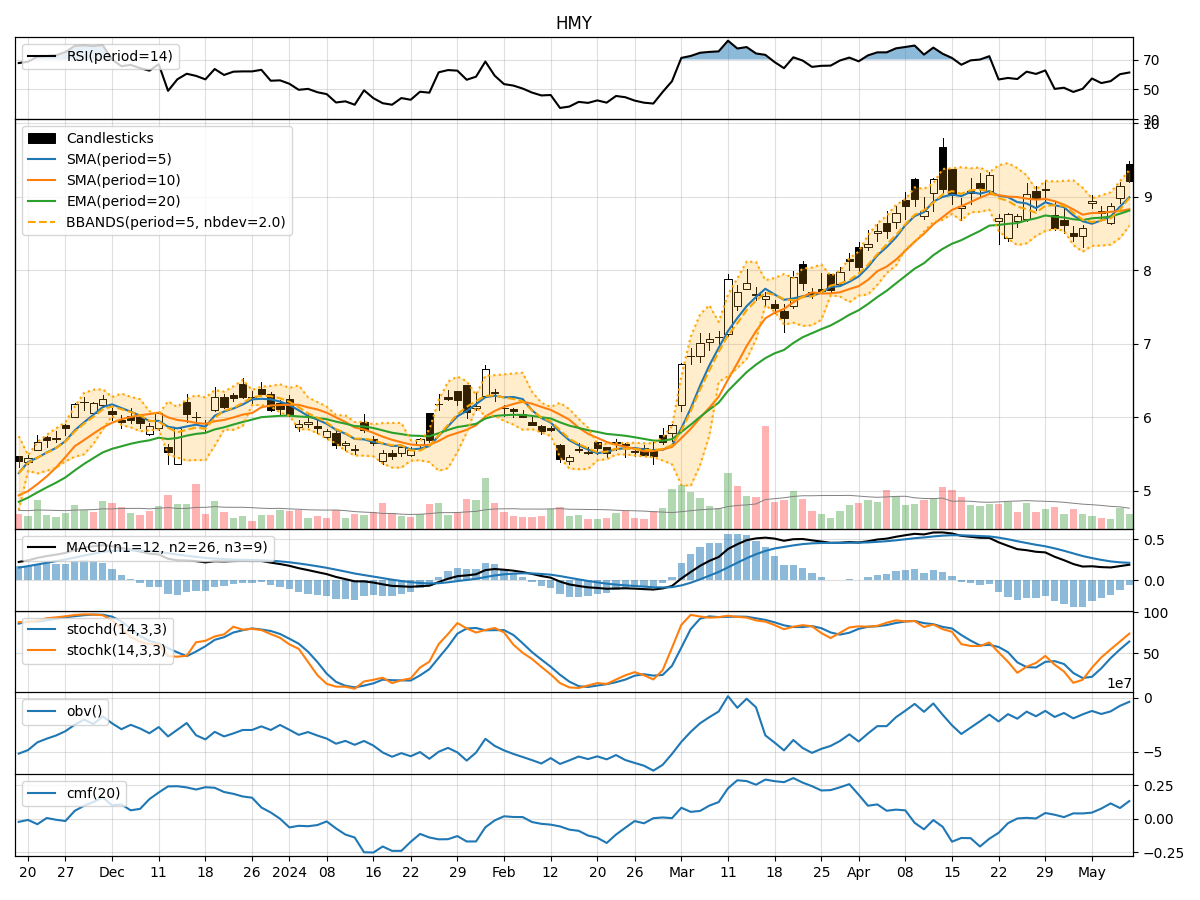
In analyzing the technical indicators for Harmony Gold Mining Company Limited (HMY) over the last 5 days, we will delve into the trends, momentum, volatility, and volume indicators to provide a comprehensive outlook on the possible stock price movement in the coming days.
Trend Indicators:
- Moving Averages (MA): The 5-day Moving Average (MA) has been consistently rising, indicating a bullish trend in the short term.
- MACD: The Moving Average Convergence Divergence (MACD) has shown positive values, suggesting upward momentum in the stock price.
- EMA: The Exponential Moving Average (EMA) has been trending upwards, supporting the bullish sentiment in the stock.
Momentum Indicators:
- RSI: The Relative Strength Index (RSI) has been in the neutral to slightly overbought territory, indicating potential strength in the stock.
- Stochastic Oscillator: Both %K and %D have been increasing, signaling positive momentum in the stock.
- Williams %R: The Williams %R is in the oversold region, suggesting a potential buying opportunity.
Volatility Indicators:
- Bollinger Bands: The Bollinger Bands have been widening, indicating increased volatility in the stock price.
- Bollinger %B: The %B indicator has been fluctuating, reflecting the volatility in the stock.
Volume Indicators:
- On-Balance Volume (OBV): The OBV has been steadily increasing, indicating accumulation by investors.
- Chaikin Money Flow (CMF): The CMF has been positive, suggesting buying pressure in the stock.
Key Observations and Opinions:
- Trend: The stock is in an upward trend supported by moving averages and MACD.
- Momentum: Momentum indicators suggest positive momentum in the stock.
- Volatility: Volatility has been increasing, which may lead to larger price swings.
- Volume: Accumulation is evident through rising OBV and positive CMF.
Conclusion:
Based on the analysis of the technical indicators, the next few days for HMY stock are likely to see further upward movement. The bullish trend, positive momentum, increasing volatility, and strong volume accumulation all point towards a bullish outlook for the stock. Investors may consider buying opportunities in anticipation of potential price appreciation.
Disclaimer:
This analysis is based solely on technical indicators and historical data. It is essential to consider other factors such as market news, economic conditions, and company fundamentals before making investment decisions. Always conduct thorough research and consult with a financial advisor for personalized guidance tailored to your investment goals and risk tolerance.