Technical Analysis of HII 2024-05-10
Overview:
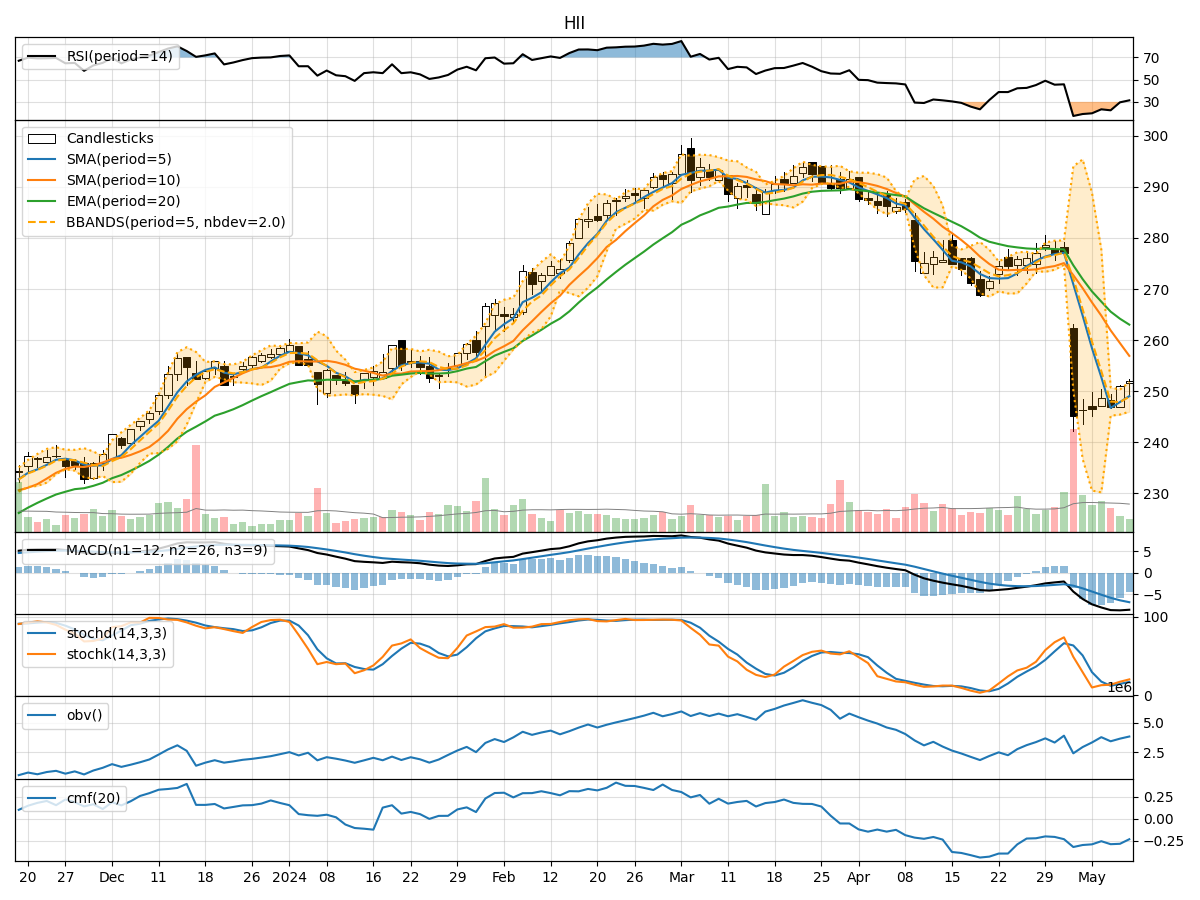
In analyzing the technical indicators for HII stock over the last 5 days, we will delve into the trend, momentum, volatility, and volume indicators to provide a comprehensive outlook on the possible stock price movement in the coming days.
Trend Analysis:
- Moving Averages (MA): The 5-day MA has been consistently below the closing prices, indicating a downward trend.
- MACD: The MACD line has been negative, with the MACD histogram showing a decreasing trend, signaling bearish momentum.
Momentum Analysis:
- RSI: The RSI has been relatively low, suggesting oversold conditions.
- Stochastic Oscillator: Both %K and %D have been increasing but remain in the oversold territory.
Volatility Analysis:
- Bollinger Bands (BB): The stock price has been trading below the lower Bollinger Band, indicating oversold conditions.
Volume Analysis:
- On-Balance Volume (OBV): The OBV has been fluctuating, indicating indecision among investors.
- Chaikin Money Flow (CMF): The CMF has been negative, suggesting selling pressure.
Key Observations:
- The stock is currently in a downtrend based on moving averages and MACD.
- Momentum indicators suggest the stock is oversold but still in a bearish phase.
- Volatility indicators show the stock is oversold based on Bollinger Bands.
- Volume indicators reflect selling pressure as seen in OBV and CMF.
Conclusion:
Based on the technical analysis of the trend, momentum, volatility, and volume indicators, the stock is likely to continue its downward movement in the coming days. Investors should exercise caution and consider waiting for signs of a reversal before considering any long positions. The overall outlook is bearish, and a potential further decline in stock price is anticipated.