Technical Analysis of HD 2024-05-10
Overview:
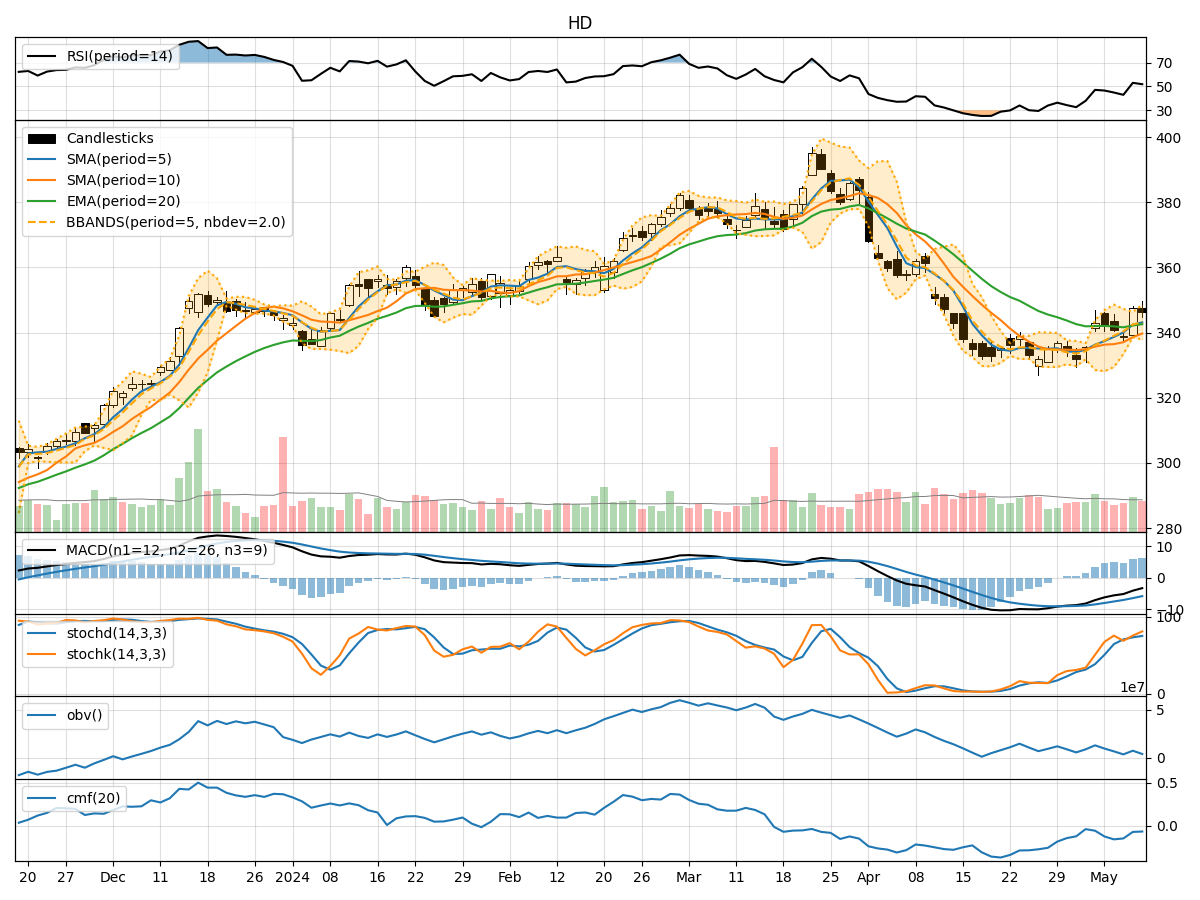
In analyzing the technical indicators for Home Depot (HD) stock over the last 5 days, we will delve into the trends, momentum, volatility, and volume indicators to provide insights into the possible future stock price movements. By examining key metrics such as moving averages, MACD, RSI, Bollinger Bands, and OBV, we aim to offer a comprehensive analysis and make informed predictions for the next few days.
Trend Indicators:
- Moving Averages (MA): The 5-day MA has been showing a slight uptrend, indicating a short-term positive momentum in the stock price.
- MACD: The MACD line has been consistently above the signal line, suggesting bullish momentum in the stock.
- EMA: The EMA has been relatively stable, indicating a potential consolidation phase in the stock price.
Momentum Indicators:
- RSI: The RSI has been fluctuating around the neutral zone, indicating a lack of strong momentum in either direction.
- Stochastic Oscillator: Both %K and %D have been in the overbought territory, suggesting a potential reversal or consolidation phase.
- Williams %R: The Williams %R is showing oversold conditions, indicating a possible bullish reversal.
Volatility Indicators:
- Bollinger Bands: The stock price has been trading within the Bollinger Bands, suggesting a period of consolidation and range-bound trading.
- Bollinger %B: The %B indicator is hovering around the middle range, indicating a balanced market sentiment.
- Bollinger Band Width: The Band Width has been relatively stable, indicating low volatility in the stock price.
Volume Indicators:
- On-Balance Volume (OBV): The OBV has been fluctuating, indicating indecision among investors regarding the stock.
- Chaikin Money Flow (CMF): The CMF has been negative, suggesting selling pressure in the stock.
Key Observations and Opinions:
- Trend: The stock is currently in a consolidation phase with a slight bullish bias based on moving averages and MACD.
- Momentum: Momentum indicators are mixed, with RSI and Stochastic Oscillator showing conflicting signals.
- Volatility: Bollinger Bands indicate a period of consolidation, while Bollinger %B and Band Width suggest low volatility.
- Volume: The OBV and CMF indicate a lack of strong buying interest in the stock.
Conclusion:
Based on the analysis of technical indicators, the next few days for HD stock are likely to see sideways movement with a slight upward bias. Investors should closely monitor key levels such as the moving averages and MACD for potential breakout or reversal signals. It is advisable to exercise caution and wait for clearer signals before making significant trading decisions.