Technical Analysis of HAL 2024-05-10
Overview:
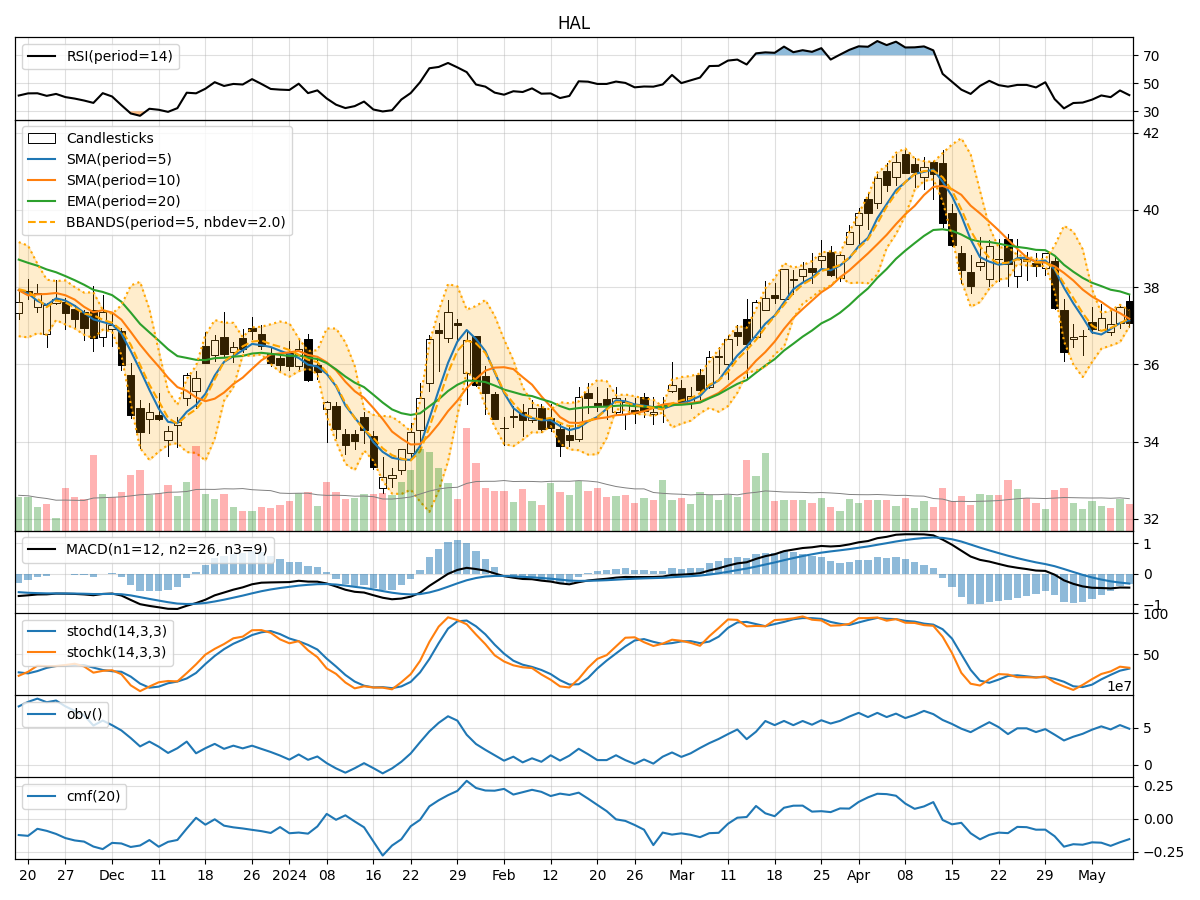
In analyzing the technical indicators for HAL over the last 5 days, we will delve into the trend, momentum, volatility, and volume indicators to provide a comprehensive outlook on the possible stock price movement in the coming days. By examining these key indicators, we aim to offer valuable insights and predictions for potential investors.
Trend Analysis:
- Moving Averages (MA): The 5-day Moving Average (MA) has been fluctuating around the closing prices, indicating a short-term trend. The Simple Moving Average (SMA) and Exponential Moving Average (EMA) show a downward trend, with the EMA consistently below the SMA.
- MACD: The Moving Average Convergence Divergence (MACD) line has been negative, indicating a bearish trend. The MACD Histogram has also been decreasing, suggesting a weakening bearish momentum.
Momentum Analysis:
- RSI: The Relative Strength Index (RSI) has been fluctuating but generally below 50, indicating a lack of strong momentum. This suggests a neutral to slightly bearish sentiment.
- Stochastic Oscillator: Both %K and %D have been below 50, indicating a bearish momentum. The Williams %R (WILLR) is also in the oversold territory, suggesting a potential reversal.
Volatility Analysis:
- Bollinger Bands (BB): The stock price has been trading within the Bollinger Bands, with the bands narrowing, indicating decreasing volatility. The %B indicator is below 1, suggesting a potential oversold condition.
- Average True Range (ATR): The ATR has been relatively stable, indicating consistent price movements without significant spikes in volatility.
Volume Analysis:
- On-Balance Volume (OBV): The OBV has been fluctuating, indicating mixed buying and selling pressure. This suggests indecision among market participants.
- Chaikin Money Flow (CMF): The CMF has been negative, indicating a lack of buying pressure and potential distribution.
Conclusion:
Based on the analysis of the technical indicators, the stock price of HAL is likely to experience further downward movement in the coming days. The trend indicators show a bearish sentiment, supported by the negative MACD and decreasing moving averages. The momentum indicators also suggest a lack of strong buying interest, with the RSI below 50 and stochastic indicators in bearish territory. Additionally, the volatility indicators point towards decreasing volatility, potentially leading to a consolidation phase.
Considering the overall technical picture, it is advisable to exercise caution and potentially consider short-term trading strategies or wait for clearer signals before entering a position in HAL. The current market dynamics indicate a bearish outlook for the stock in the near term.