Technical Analysis of HAFN 2024-05-10
Overview:
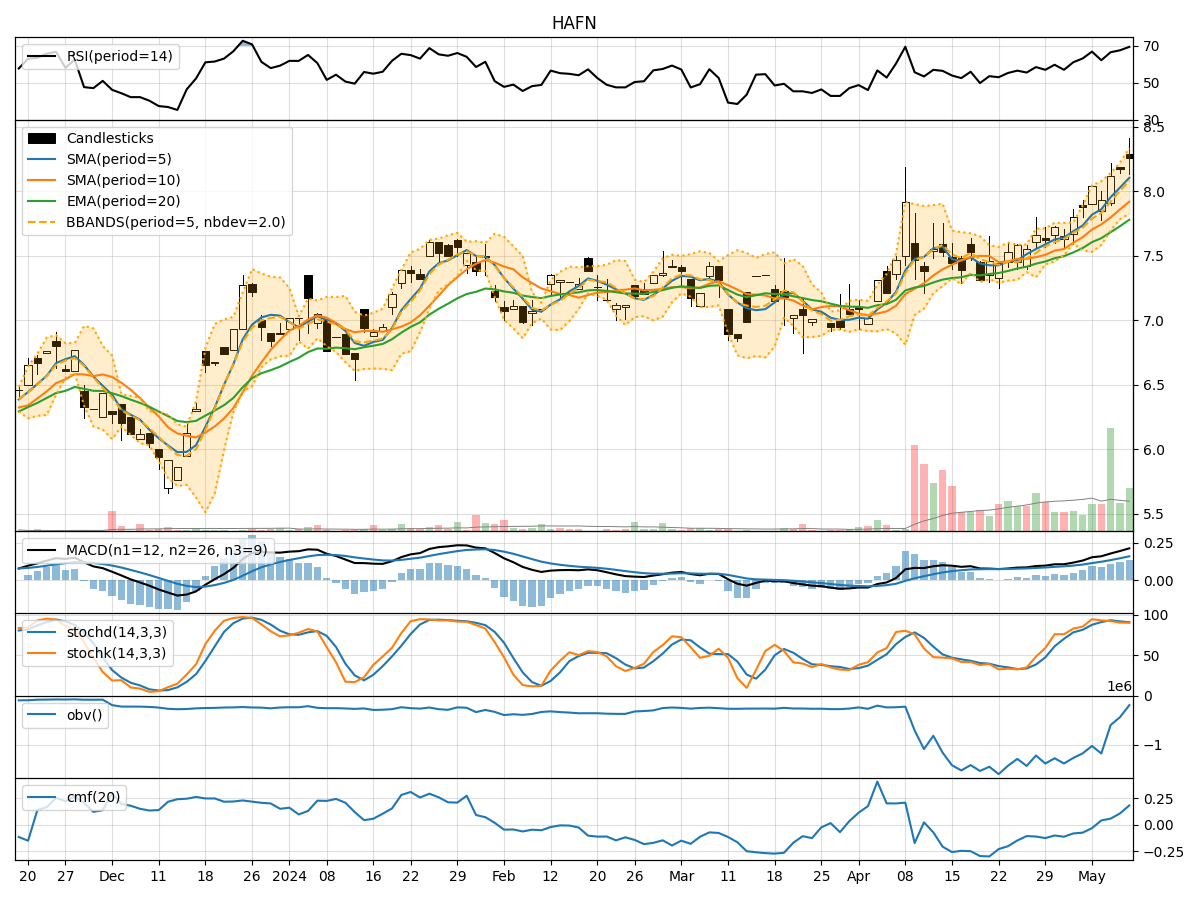
In analyzing the technical indicators for HAFN stock over the last 5 days, we will delve into the trend, momentum, volatility, and volume indicators to provide a comprehensive outlook on the possible stock price movement in the coming days.
Trend Analysis:
- Moving Averages (MA): The 5-day Moving Average (MA) has been consistently above the Simple Moving Average (SMA) and Exponential Moving Average (EMA), indicating an upward trend in the stock price.
- MACD: The MACD line has been consistently above the signal line, with both lines showing an upward trajectory, suggesting bullish momentum in the stock.
Momentum Analysis:
- RSI: The Relative Strength Index (RSI) has been hovering in the overbought territory above 70, indicating a potential overbought condition in the stock.
- Stochastic Oscillator: Both %K and %D lines of the Stochastic Oscillator have been trending downwards, suggesting a weakening momentum in the stock price.
Volatility Analysis:
- Bollinger Bands (BB): The stock price has been consistently trading above the middle Bollinger Band (BBM), indicating an upward price movement. The narrowing of the bands suggests decreasing volatility.
- Bollinger %B (BBP): The %B indicator has been above 0.5, indicating that the stock price is trading above the middle band and potentially in an overbought condition.
Volume Analysis:
- On-Balance Volume (OBV): The OBV has shown mixed signals with fluctuations, indicating indecisiveness in the buying and selling pressure.
- Chaikin Money Flow (CMF): The CMF has been gradually increasing, suggesting positive money flow into the stock.
Conclusion:
Based on the analysis of the technical indicators, the stock of HAFN is currently exhibiting bullish tendencies in the short term. However, caution is advised as the RSI indicates an overbought condition, and the Stochastic Oscillator suggests a weakening momentum. The narrowing Bollinger Bands indicate decreasing volatility, which could lead to a consolidation phase in the stock price.
Recommendation:
Considering the overall bullish sentiment but with caution due to the overbought RSI and weakening momentum, investors may consider taking profits on existing positions or waiting for a pullback before entering new positions. Monitoring the price action closely in the coming days is crucial to assess whether the stock will continue its upward trajectory or enter a consolidation phase.
Disclaimer:
This analysis is based solely on technical indicators and does not take into account fundamental factors that may impact the stock price. It is essential to conduct thorough research and consider multiple factors before making any investment decisions.