Technical Analysis of GPN 2024-05-10
Overview:
In analyzing the technical indicators for Global Payments Inc. (GPN) over the last 5 days, we will delve into the trends, momentum, volatility, and volume indicators to provide insights into the possible future stock price movements. By examining these key aspects, we aim to offer a comprehensive analysis and make informed predictions for the upcoming days.
Trend Analysis:
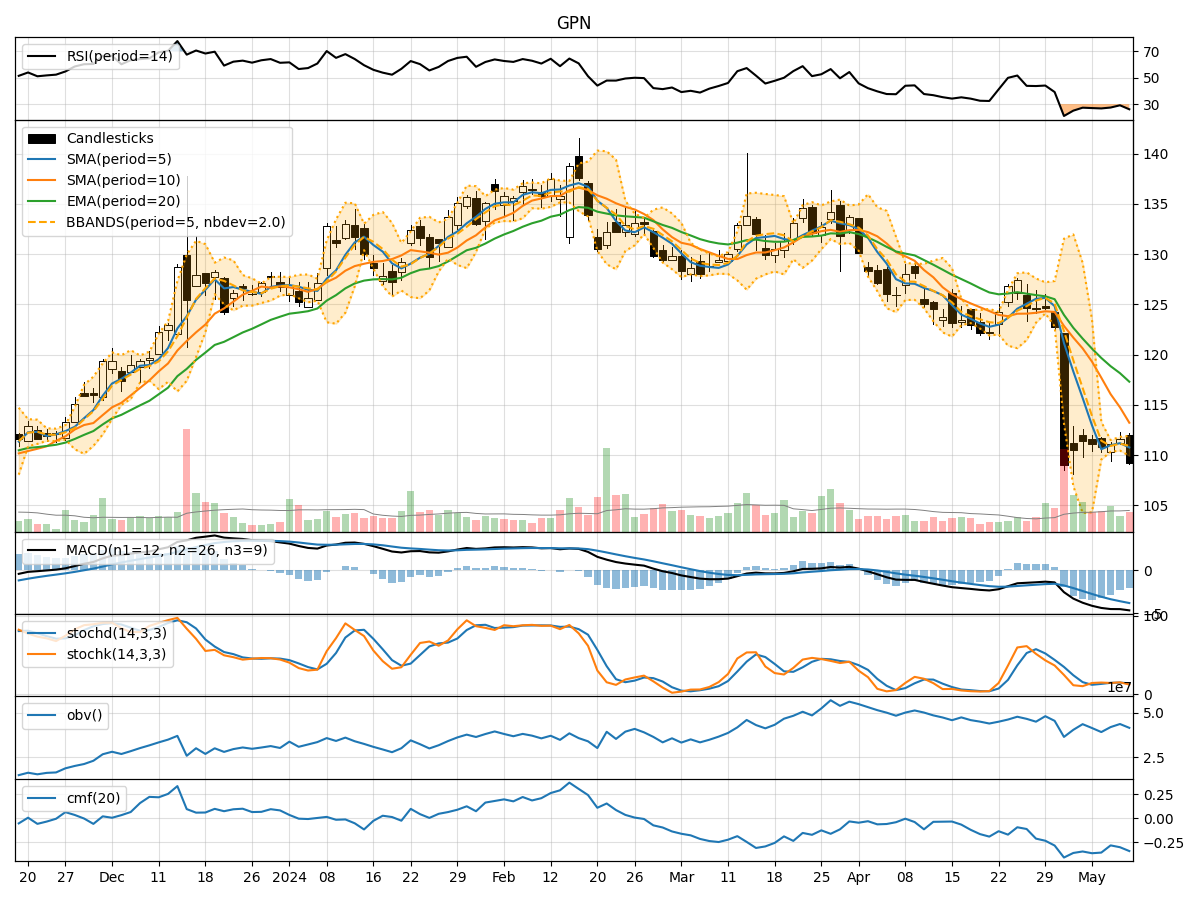
- Moving Averages (MA): The 5-day Moving Average (MA) has been consistently below the Simple Moving Average (SMA) and Exponential Moving Average (EMA) over the past 5 days, indicating a downtrend in the stock price.
- MACD: The Moving Average Convergence Divergence (MACD) has been negative, with the MACD line below the signal line, suggesting bearish momentum in the stock.
Momentum Analysis:
- RSI: The Relative Strength Index (RSI) has been relatively low, indicating oversold conditions in the stock.
- Stochastic Oscillator: Both %K and %D lines of the Stochastic Oscillator have been trending downwards, reflecting weakening momentum.
Volatility Analysis:
- Bollinger Bands (BB): The stock price has been trading within the Bollinger Bands, with the bands narrowing, suggesting reduced volatility in the stock.
- Bollinger %B: The %B indicator is close to 0, indicating that the stock price is near the lower band, potentially signaling an oversold condition.
Volume Analysis:
- On-Balance Volume (OBV): The OBV has been fluctuating, indicating mixed buying and selling pressure in the stock.
- Chaikin Money Flow (CMF): The CMF has been negative, suggesting outflow of money from the stock.
Conclusion:
Based on the analysis of the technical indicators, the stock of GPN is currently exhibiting bearish tendencies. The downtrend in moving averages, negative MACD, oversold RSI, weakening momentum in the Stochastic Oscillator, reduced volatility within the Bollinger Bands, and negative CMF all point towards a potential further decline in the stock price in the coming days.
Recommendation:
Considering the overall bearish outlook, investors may want to exercise caution and consider short-term selling opportunities or wait for a more favorable entry point before considering long positions. It is essential to monitor the stock closely for any signs of reversal or stabilization in the technical indicators before making any significant investment decisions.
Disclaimer:
Please note that technical analysis is not a guaranteed predictor of future price movements, and other fundamental factors can also influence stock prices. It is crucial to conduct thorough research and consider multiple indicators before making any investment decisions. Consulting with a financial advisor is recommended for personalized investment advice tailored to individual risk tolerance and financial goals.