Technical Analysis of GOLD 2024-05-10
Overview:
In analyzing the technical indicators for GOLD over the last 5 days, we will delve into the trends, momentum, volatility, and volume indicators to provide a comprehensive outlook on the possible stock price movement in the coming days.
Trend Indicators:
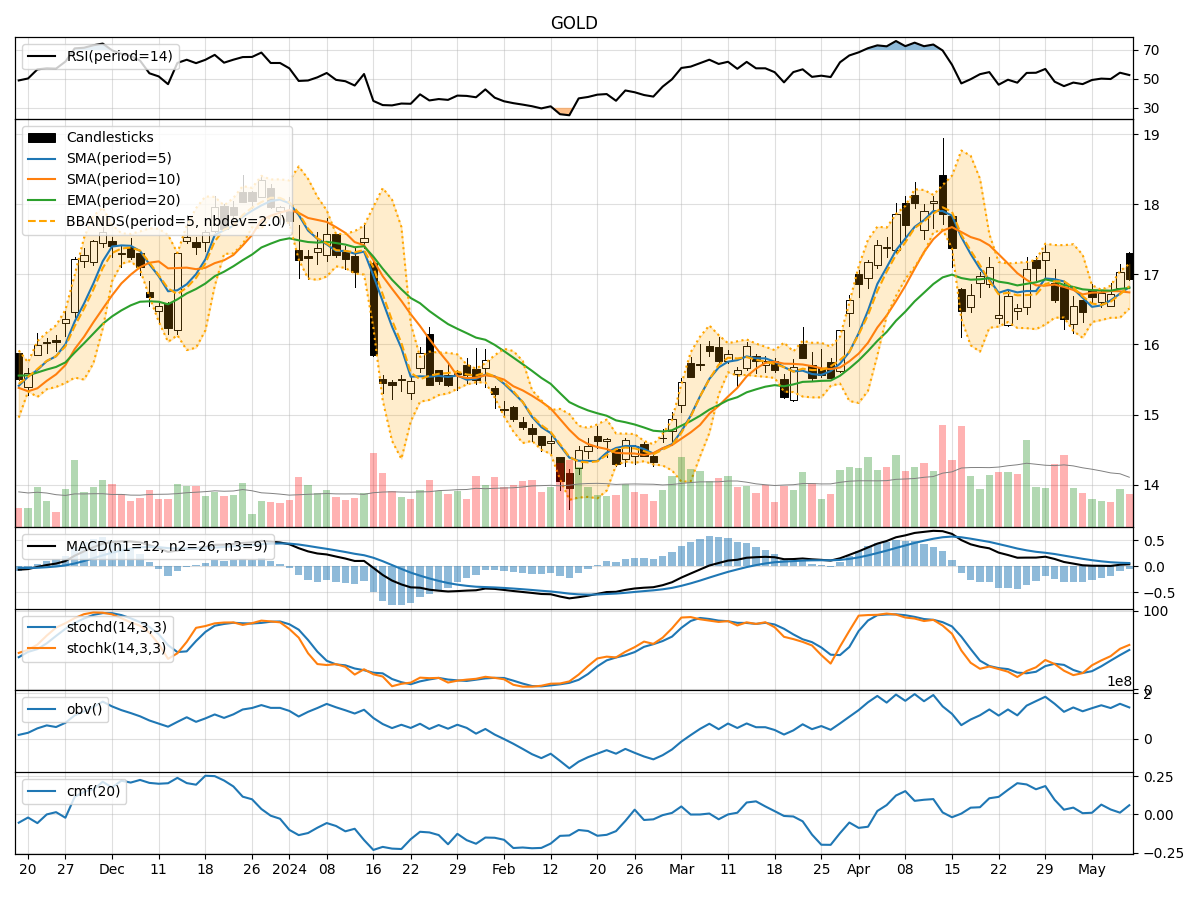
- Moving Averages (MA): The 5-day MA has been fluctuating around the closing prices, indicating short-term price trends. The Simple Moving Average (SMA) and Exponential Moving Average (EMA) show a slight decline, suggesting a potential bearish sentiment.
- Moving Average Convergence Divergence (MACD): The MACD and Signal line have been converging, but the MACD Histogram remains negative, indicating a bearish momentum.
Momentum Indicators:
- Relative Strength Index (RSI): The RSI has been hovering around the neutral zone, indicating a lack of strong momentum in either direction.
- Stochastic Oscillator: Both %K and %D lines have been rising, suggesting a potential bullish momentum.
- Williams %R (Willams %R): The Williams %R is in the oversold territory, indicating a potential buying opportunity.
Volatility Indicators:
- Bollinger Bands (BB): The price has been trading within the bands, with the bands narrowing, suggesting a period of consolidation. The %B indicator is below 1, indicating a potential oversold condition.
- Average True Range (ATR): The ATR has been relatively stable, indicating consistent price movements without significant volatility spikes.
Volume Indicators:
- On-Balance Volume (OBV): The OBV has been fluctuating, indicating mixed buying and selling pressure.
- Chaikin Money Flow (CMF): The CMF has been positive, suggesting a potential inflow of money into the stock.
Key Observations:
- The trend indicators show a bearish sentiment with declining moving averages and a negative MACD Histogram.
- Momentum indicators present a mixed picture with RSI in the neutral zone, Stochastic showing bullish momentum, and Williams %R indicating a potential buying opportunity.
- Volatility indicators suggest a period of consolidation with narrowing Bollinger Bands and stable ATR.
- Volume indicators reflect mixed buying and selling pressure with a positive CMF.
Conclusion:
Based on the analysis of the technical indicators, the stock price of GOLD is likely to experience sideways movement in the coming days. The bearish trend indicators and neutral momentum indicators suggest a lack of strong directional bias. However, the potential buying opportunity indicated by Williams %R and positive CMF could lead to some upward movement. Traders should exercise caution and wait for clearer signals before taking significant positions.