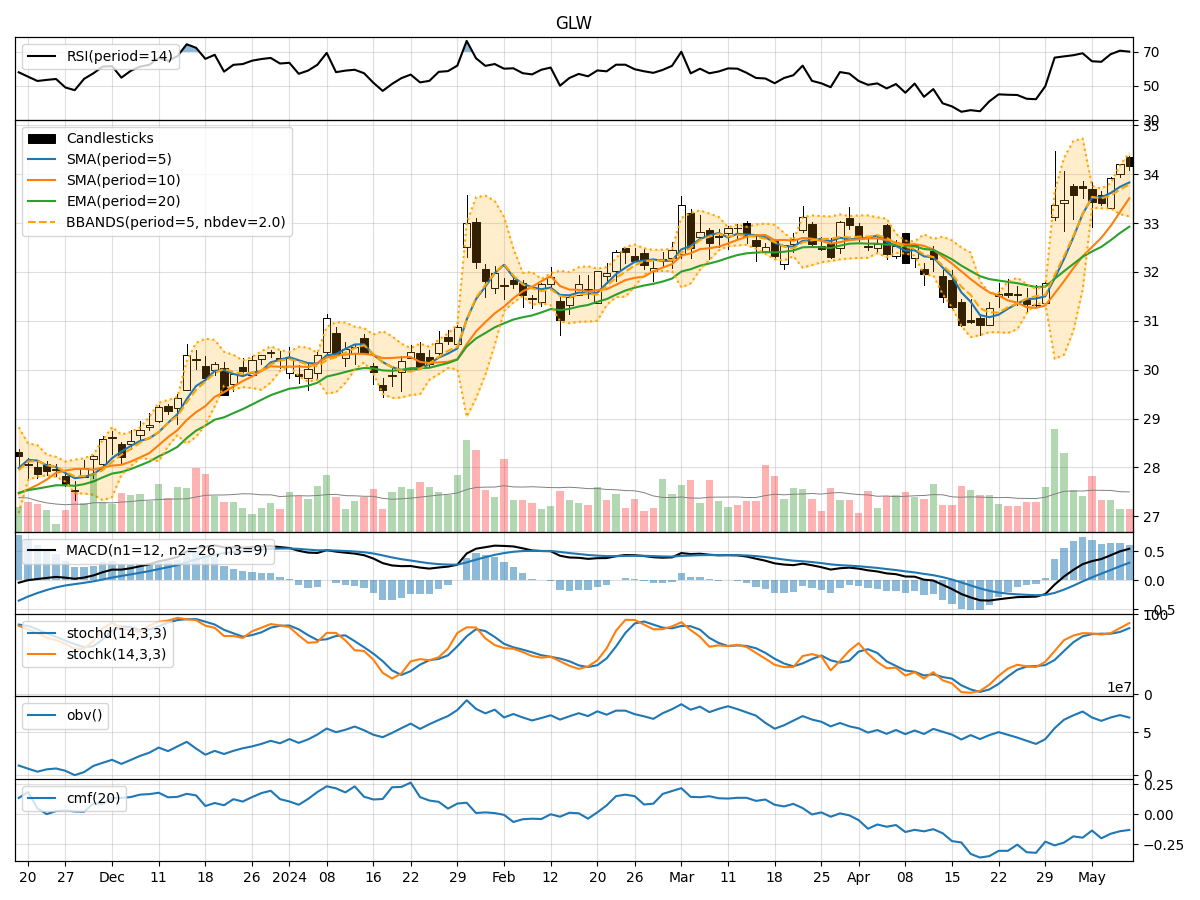
Technical Analysis of GLW 2024-05-10
Overview:
In analyzing the technical indicators for Corning Incorporated (GLW) over the last 5 days, we will delve into the trend, momentum, volatility, and volume indicators to provide a comprehensive outlook on the possible stock price movement in the coming days.
Trend Analysis:
- Moving Averages (MA): The 5-day Moving Average (MA) has been steadily increasing, indicating a positive trend in the short term.
- MACD: The Moving Average Convergence Divergence (MACD) has been consistently positive, suggesting bullish momentum.
- RSI: The Relative Strength Index (RSI) has been in the overbought territory, indicating a potential reversal or consolidation.
Momentum Analysis:
- Stochastic Oscillator: Both %K and %D have been in the overbought zone, signaling a potential pullback or reversal.
- Williams %R: The Williams %R is also in the oversold region, indicating a possible reversal in the short term.
Volatility Analysis:
- Bollinger Bands: The Bollinger Bands have been widening, suggesting increased volatility in the stock price.
- Average True Range (ATR): ATR has been relatively stable, indicating consistent price movements.
Volume Analysis:
- On-Balance Volume (OBV): The OBV has shown mixed signals, reflecting indecision among market participants.
- Chaikin Money Flow (CMF): The CMF has been negative, indicating selling pressure in the stock.
Key Observations:
- The trend indicators suggest a bullish sentiment in the short term.
- Momentum indicators point towards a potential reversal or pullback due to overbought conditions.
- Volatility indicators indicate increased price fluctuations, which could lead to both opportunities and risks.
- Volume indicators show mixed signals, reflecting uncertainty in market sentiment.
Conclusion:
Based on the analysis of the technical indicators, the stock price of GLW is likely to experience a short-term pullback or consolidation due to overbought conditions in momentum indicators and mixed signals in volume indicators. However, the overall trend remains bullish, supported by positive moving averages and MACD. Traders should exercise caution and consider waiting for a clearer signal before making trading decisions.