Technical Analysis of GIB 2024-05-10
Overview:
In analyzing the technical indicators for GIB over the last 5 days, we will delve into the trend, momentum, volatility, and volume indicators to provide a comprehensive outlook on the possible stock price movement in the coming days. By examining these key aspects, we aim to offer valuable insights and recommendations for potential investors.
Trend Indicators:
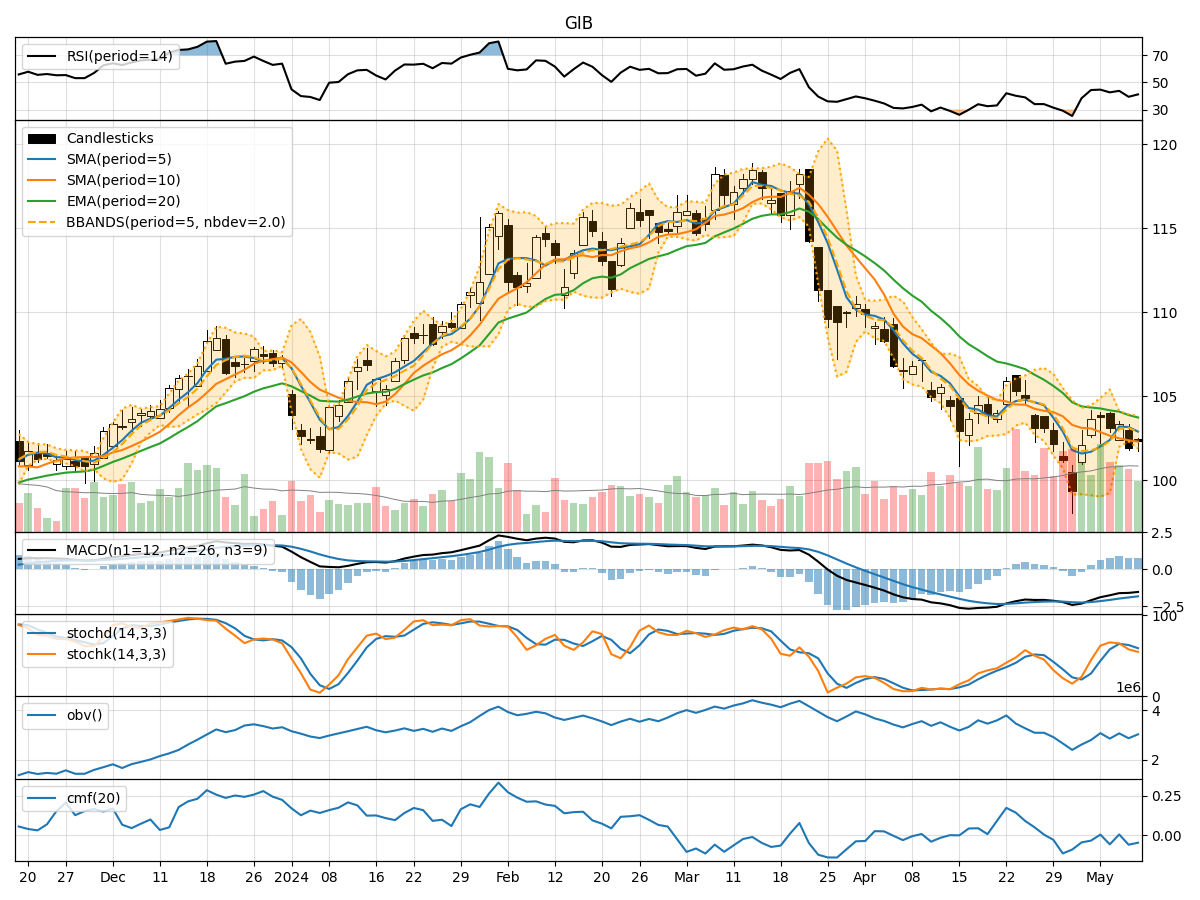
- Moving Averages (MA): The 5-day Moving Average (MA) has been fluctuating around the closing prices, indicating short-term price trends. The Simple Moving Average (SMA) and Exponential Moving Average (EMA) show a slight downward trend, suggesting a potential bearish sentiment.
- MACD: The Moving Average Convergence Divergence (MACD) has been negative, with the MACD line consistently below the signal line. This indicates a bearish momentum in the stock.
- Conclusion: The trend indicators suggest a bearish outlook for GIB in the short term.
Momentum Indicators:
- RSI: The Relative Strength Index (RSI) has been hovering around the mid-level, indicating a neutral sentiment in terms of momentum.
- Stochastic Oscillator: Both %K and %D lines of the Stochastic Oscillator have been declining, signaling a weakening momentum.
- Williams %R: The Williams %R is in the oversold territory, suggesting a potential reversal or consolidation.
- Conclusion: The momentum indicators point towards a neutral to bearish momentum for GIB.
Volatility Indicators:
- Bollinger Bands (BB): The Bollinger Bands have been narrowing, indicating decreasing volatility in the stock price.
- Conclusion: The volatility indicators suggest a decreasing volatility environment for GIB.
Volume Indicators:
- On-Balance Volume (OBV): The OBV has been fluctuating, indicating a lack of strong buying or selling pressure.
- Chaikin Money Flow (CMF): The CMF has been negative, suggesting a bearish money flow in the stock.
- Conclusion: The volume indicators reflect a neutral to bearish sentiment in terms of volume activity.
Overall Conclusion:
Based on the analysis of the trend, momentum, volatility, and volume indicators, the overall outlook for GIB in the next few days is bearish. The trend indicators show a downward trend, supported by the negative MACD. Momentum indicators suggest a neutral to bearish momentum, while volatility indicators point towards decreasing volatility. Volume indicators also indicate a neutral to bearish sentiment in terms of volume activity.
Recommendation:
Considering the comprehensive analysis of the technical indicators, it is advisable to exercise caution when considering investments in GIB in the coming days. Traders may look for potential short-selling opportunities or wait for a clearer trend reversal signal before considering long positions. Monitoring key support and resistance levels along with any significant news or market developments is crucial for making informed trading decisions.