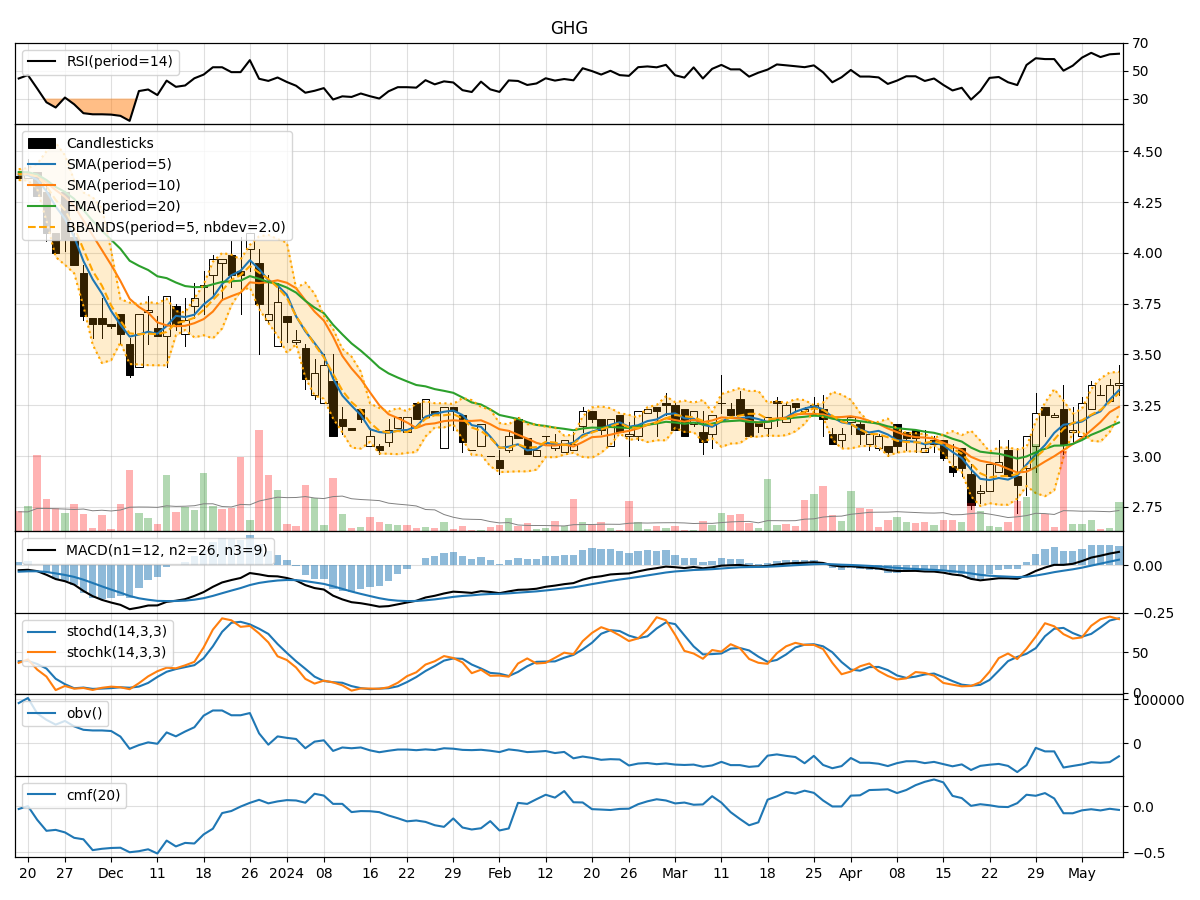
Technical Analysis of GHG 2024-05-10
Overview:
In analyzing the technical indicators for GHG stock over the last 5 days, we will delve into the trend, momentum, volatility, and volume indicators to provide a comprehensive outlook on the possible stock price movement in the coming days.
Trend Analysis:
- Moving Averages (MA): The 5-day Moving Average (MA) has been consistently rising, indicating a bullish trend in the short term.
- MACD: The Moving Average Convergence Divergence (MACD) has shown positive values, suggesting upward momentum in the stock price.
- EMA: The Exponential Moving Average (EMA) has been trending upwards, supporting the bullish sentiment in the stock.
Momentum Analysis:
- RSI: The Relative Strength Index (RSI) has been hovering around 60-63, indicating a neutral to slightly bullish momentum.
- Stochastic Oscillator: Both %K and %D values have been relatively high, signaling a bullish momentum.
- Williams %R: The Williams %R is in the oversold territory, suggesting a potential reversal in the stock price.
Volatility Analysis:
- Bollinger Bands: The Bollinger Bands have shown narrowing, indicating decreasing volatility in the stock.
- Bollinger %B: The %B value has been fluctuating around 0.7-0.8, suggesting a consolidation phase in the stock price.
Volume Analysis:
- On-Balance Volume (OBV): The OBV has been negative, indicating selling pressure in the stock.
- Chaikin Money Flow (CMF): The CMF has been negative, reflecting a lack of buying interest in the stock.
Key Observations:
- The trend indicators suggest a bullish sentiment in the short term.
- Momentum indicators show a mixed signal with a slight bullish bias.
- Volatility indicators point towards decreasing volatility and a potential consolidation phase.
- Volume indicators indicate selling pressure and a lack of significant buying interest.
Conclusion:
Based on the analysis of the technical indicators, the next few days' possible stock price movement for GHG is likely to be sideways with a slight bullish bias. The stock may experience a period of consolidation with limited volatility as buyers and sellers reach an equilibrium. Traders should closely monitor key support and resistance levels for potential breakout opportunities.